The solar wind
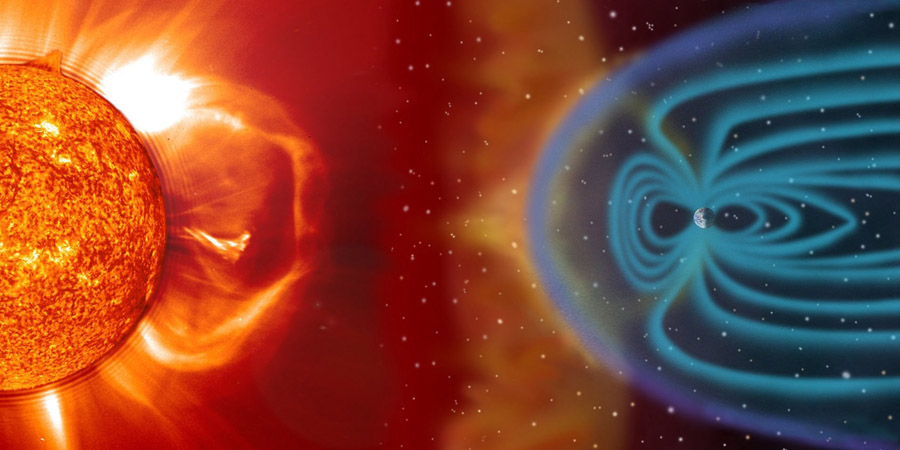
The solar wind is a stream of charged particles (a plasma) released from the Sun. This stream constantly varies in speed, density and temperature. The most dramatic difference in these three parameters occur when the solar wind escapes from a coronal hole or as a coronal mass ejection. A stream originating from a coronal hole can be seen as a steady high-speed stream of solar wind as where a coronal mass ejection is more like an enormous fast-moving cloud of solar plasma. When these solar wind structures arrive at Earth they encounter Earth’s magnetic field where solar wind particles are able to enter our atmosphere around our planet’s magnetic north and south pole. The solar wind particles collide there with the atoms that make up our atmosphere like nitrogen and oxygen atoms which in turn gives them energy which they slowly release as light.
Image: Artist impression of the solar wind as it travels from the Sun and encounters Earth’s magnetosphere. This image is not to scale.
The speed of the solar wind
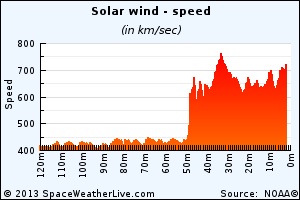
The speed of the solar wind is an important factor. Particles with a higher speed hit Earth’s magnetosphere harder and have a higher chance of causing disturbed geomagnetic conditions as they compress the magnetosphere. The solar wind speed at Earth normally lies around 300km/sec but increases when a coronal hole high speed stream (CH HSS) or coronal mass ejection (CME) arrives. During a coronal mass ejection impact, the solar wind speed can jump suddenly to 500, or even more than 1000km/sec. For the lower middle latitudes a decent speed is required and values higher than 700km/sec are desirable. This is however not a golden rule and strong geomagnetic storming can also occur during lower speeds if the interplanetary magnetic field values are favorable for enhanced geomagnetic conditions. On the data plots you can easily see when a coronal mass ejection shock has arrived: the solar wind speed increases with sometimes several 100km/sec. It will then take about 15 to 45 minutes (depending on the solar wind speed at impact) before the shock wave passes Earth and the magnetometers start to respond.

Image: The arrival of a coronal mass ejection in 2013, the difference in speed is obvious.
The density of the solar wind
This parameter shows us how the dense the solar wind is. The more particles in the solar wind, the more chances we get for an auroral display as more particles collide with Earth’s magnetosphere. The scale used in the plots on our website is particles per cubic centimeter or p/cm³. A value above 20p/cm³ is a good start for a strong geomagnetic storm but it is no guarantee that we get to see any aurora as the solar wind speed and the interplanetary magnetic field parameters also need to be favorable.
Measuring the solar wind
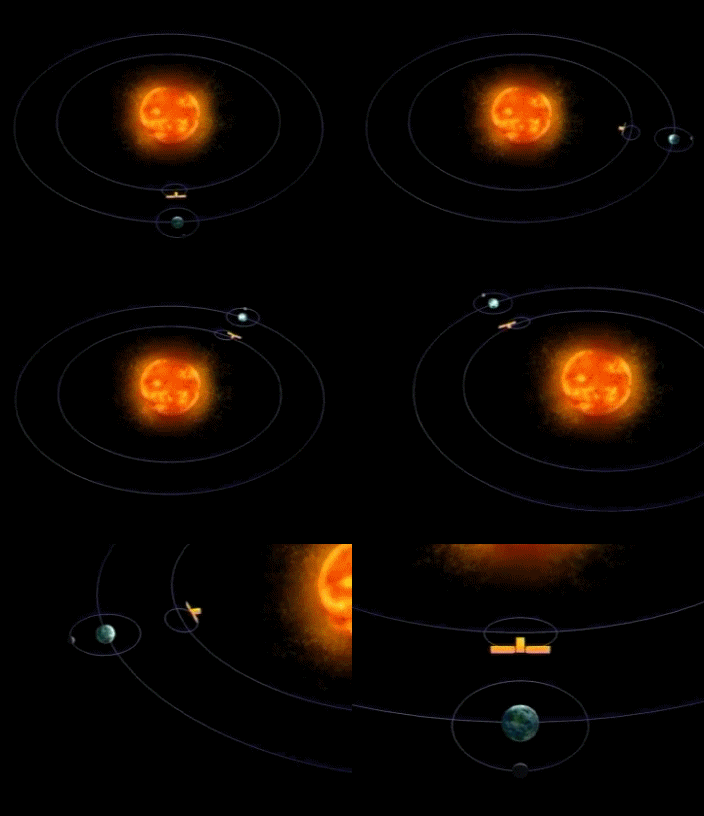
The real-time solar wind and interplanetary magnetic field data that you can find on this website come from the Deep Space Climate Observatory (DSCOVR) satellite which is stationed in an orbit around the Sun-Earth Lagrange Point 1. This is a point in space which is always located between the Sun and Earth where the gravity of the Sun and Earth have an equal pull on satellites meaning they can remain in a stable orbit around this point. This point is ideal for solar missions like DSCOVR, as this gives DSCOVR the opportunity to measure the parameters of the solar wind and the interplanetary magnetic field before it arrives at Earth. This gives us a 15 to 60 minute warning time (depending on the solar wind speed) as to what kind of solar wind structures are on their way to Earth.

Image: The location of a satellite at the Sun-Earth L1 point.
There is actually one more satellite at the Sun-Earth L1 point that measures solar wind and interplanetary magnetic field data: the Advanced Composition Explorer. This satellite used to be the primary data source up until July 2016 when the Deep Space Climate Observatory (DSCOVR) mission became fully operational. The Advanced Composition Explorer (ACE) satellite is still collecting data and now operates as a backup to DSCOVR.
Latest news
Latest forum messages
Support SpaceWeatherLive.com!
A lot of people come to SpaceWeatherLive to follow the Sun's activity or if there is aurora to be seen, but with more traffic comes higher server costs. Consider a donation if you enjoy SpaceWeatherLive so we can keep the website online!

Space weather facts
| Last X-flare | 2025/03/28 | X1.1 |
| Last M-flare | 2025/03/28 | M1.7 |
| Last geomagnetic storm | 2025/03/27 | Kp5 (G1) |
| Spotless days | |
|---|---|
| Last spotless day | 2022/06/08 |
| Monthly mean Sunspot Number | |
|---|---|
| February 2025 | 154.6 +17.6 |
| March 2025 | 128.3 -26.4 |
| Last 30 days | 128.3 -23.7 |


