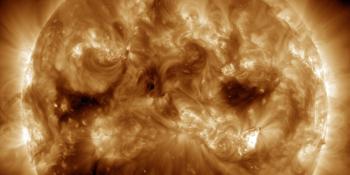
Visualizzazione archivio di mercoledì, 19 gennaio AM
Rapporto attività solare
Ogni brillamento solare menzionato nel rapporto ha un fattore di scala, applicato dal Centro di Predizione Meteorologica Spaziale (SWPC). A causa del fattore di scala del SWPC, i brillamenti solari sono segnalati come ridotti del 42%, rispetto ai dati di qualità scientifica. Il fattore di scala è stato rimosso dai nostri dati archiviati sui brillamenti solari, per riflettere le unità fisiche reali.
Rapporto dell'Attività Geofisica Solare 2005 Jan 19 2200 UTCPreparati dal SWPC della NOAA© ed elaborati da SpaceWeatherLive.com
Rapporto Congiunto USAF/NOAA dell'Attività Solare e Geofisica
SDF Numero 019 Emesso alle 2200Z il Jan 19 2005IA. Analisi delle Regioni Solari Attive e Attività dalle 2100Z-18 alle 2100Z-19 Solar activity was high. Region 720 (N14W56) produced
an X1/2n flare at 19/0822 UTC. This flare was similar to previous
major flares in this region with strong radio output and a CME
directed mostly to the northwest. Further decay in the region has
occurred, although it remains fairly large and magnetically complex.
IB. Previsione dell'Attività Solare
Solar activity is expected to be
moderate to high. Region 720 retains the potential for another major
event.
IIA. Sommario dell'Attività Geofisica dalle 2100Z-18 alle 2100Z-19
The geomagnetic disturbance remained in progress at the active to
severe storm level. The greater than 100 MeV proton event has ended:
start 17/1215 UTC, 28 pfu peak at 17/1700 UTC, and end 18/2205 UTC.
The greater than 10 MeV proton event remains in progress but is
decaying: start 16/0210 UTC and 5040 pfu peak at 17/1750 UTC. Proton
fluxes have decreased enough for the GOES electron sensors and ACE
SWEPAM instruments to again provide reliable data. The greater than
2 MeV electron flux at geosynchronous orbit was high.
IIB. Previsione dell'Attività Geofisica
The geomagnetic field is
expected to continue at active to severe storm levels. Storm
intensity is expected to taper off over the next 48 hours, as is the
10 MeV proton event, barring another significant solar event in
Region 720.
III. Probabilità dell'Evento dalle Jan del 20 alle Jan del 22
| Classe M | 90% | 90% | 90% |
| Classe X | 30% | 30% | 30% |
| Protone | 99% | 90% | 80% |
| PCAF | in progress | ||
IV. Flusso di 10.7 cm di Penticton
  Osservato       19 Jan 133
  Previsto   20 Jan-22 Jan  130/120/110
  Media di 90 Giorni        19 Jan 106
V. Indici Geomagnetici A
  Osservato Afr/Ap 18 Jan  035/072
  Stimato     Afr/Ap 19 Jan  050/080
  Previsto    Afr/Ap 20 Jan-22 Jan  040/050-020/030-020/030
VI. Probabilità dell'Attività Geomagnetica dal 20 Jan al 22 Jan
| A. Latitudini Medie | |||
|---|---|---|---|
| Attivo | 30% | 25% | 25% |
| Tempesta minore | 60% | 50% | 30% |
| Tempesta maggiore-grave | 10% | 05% | 05% |
| B. Latitudini Alte | |||
|---|---|---|---|
| Attivo | 05% | 20% | 40% |
| Tempesta minore | 70% | 60% | 50% |
| Tempesta maggiore-grave | 25% | 20% | 10% |
Tutti gli orari in UTC
<< Vai alla pagina della panoramica giornaliera
Ultime notizie
Ultimi messaggi dal forum
Filaments and prominences 750Unspecified geomagnetic activity 2197New satellites - Proba-3, PUNCH, SWFO-L1, GOES-U/19 35AR4048 112Unexplained proton activity 57
Altri argomentiSupporta SpaceWeatherLive.com!
Molte persone vengono su SpaceWeatherLive per seguire l'attività del Sole o sapere se ci sia la possibilità di vedere l'aurora, ma a maggior traffico corrispondono costi maggiori. Considerate una donazione se vi piace SpaceWeatherLive così che possiamo mantenere online il sito web!

Notizie sul meteo spaziale
| Ultimo brillamento X | 2025/03/28 | X1.1 |
| Ultimo brillamento M | 2025/04/01 | M2.5 |
| Ultima tempesta geomagnetica | 2025/03/27 | Kp5 (G1) |
| Giorni senza macchie | |
|---|---|
| Ultimo giorno senza macchie | 2022/06/08 |
| Media mensile Numero di Macchie Solari | |
|---|---|
| marzo 2025 | 134.2 -20.4 |
| aprile 2025 | 143 +8.8 |
| Ultimi 30 giorni | 130.4 -16.1 |


