OVATION Auroral Forecast
This model gives a short-term forecast of the intensity of the auroral oval for both the northern and the southern hemisphere. It is based on the solar wind and interplanetary magnetic field (IMF) conditions as measured by the DSCOVR spacecraft. The map shows the intensity and the location of the auroral oval for the time given in the right-hand corner of the map. Locations up to 1.000 kilometers (600 miles) north or south of the auroral oval might still see aurora near their horizon during optimal viewing conditions. This model does not take into account the local weather or the altitude of the Sun at your location.
Northern hemisphere

Southern hemisphere
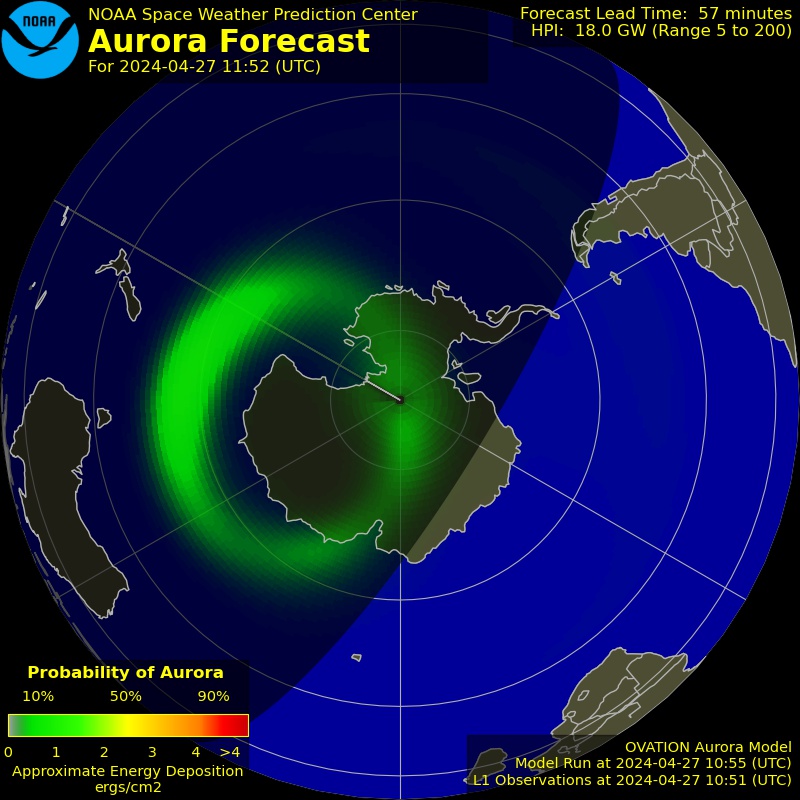
Hemispheric Power
The OVATION model calculates a globally integrated total energy deposition in GigaWatts for up to 30 minutes in the future. For values below about 20GW, there may be little or no aurora observable. For values between 20 and 50, you may need to be near the aurora to see it. For values above 50, the aurora should be quite observable with lots of activity and motion across the sky. Once the Hemispheric Power reaches levels of 100 or more, this is considered to be a very significant geomagnetic storm.
What are the odds that I can see overhead aurora from my location?
| Canada | |
|---|---|
| Halifax, NS | 0% |
| Iqaluit, NU | 18% |
| Montreal, QC | 1% |
| Ottawa, ON | 1% |
| Quebec City, QC | 1% |
| St. John's, NL | 0% |
| Thunder Bay, ON | 4% |
| Toronto, ON | 0% |
| Winnipeg, MB | 4% |
| Cuba | |
|---|---|
| Havana | 0% |
| Greenland | |
|---|---|
| Nuuk | 19% |
| Mexico | |
|---|---|
| Mexico City | 0% |
| Monterrey | 0% |
| United States | |
|---|---|
| Albuquerque, NM | 0% |
| Atlanta, GA | 0% |
| Augusta, ME | 0% |
| Bismarck, ND | 1% |
| Boston, MA | 0% |
| Casper, WY | 0% |
| Chicago, IL | 0% |
| Columbus, OH | 0% |
| Dallas, TX | 0% |
| Denver, CO | 0% |
| Detroit, MI | 0% |
| Indianapolis, IN | 0% |
| Jackson, MS | 0% |
| Lincoln, NE | 0% |
| Little Rock, AR | 0% |
| Miami, FL | 0% |
| Minneapolis, MN | 1% |
| Montpelier, VT | 0% |
| Nashville, TN | 0% |
| New York City, NY | 0% |
| Richmond, VA | 0% |
| St. Louis, MO | 0% |
| Washington, D.C. | 0% |
| Belgium | |
|---|---|
| Brussels | 0% |
| Faroe Islands | |
|---|---|
| Tórshavn | 9% |
| France | |
|---|---|
| Lyon | 0% |
| Marseille | 0% |
| Nantes | 0% |
| Nice | 0% |
| Paris | 0% |
| Toulouse | 0% |
| Germany | |
|---|---|
| Cologne | 0% |
| Frankfurt | 0% |
| Munich | 0% |
| Iceland | |
|---|---|
| Reykjavik | 17% |
| Ireland | |
|---|---|
| Dublin | 0% |
| Italy | |
|---|---|
| Milan | 0% |
| Naples | 0% |
| Rome | 0% |
| Turin | 0% |
| Netherlands | |
|---|---|
| Amsterdam | 0% |
| Portugal | |
|---|---|
| Lisbon | 0% |
| Porto | 0% |
| Slovenia | |
|---|---|
| Ljubljana | 0% |
| Spain | |
|---|---|
| Barcelona | 0% |
| Madrid | 0% |
| Switzerland | |
|---|---|
| Bern | 0% |
| United Kingdom | |
|---|---|
| Belfast | 0% |
| Birmingham | 0% |
| Edinburgh | 0% |
| London | 0% |
| Manchester | 0% |
| Argentina | |
|---|---|
| Buenos Aires | 0% |
| Comodoro Rivadavia | 0% |
| Ushuaia | 0% |
| Chile | |
|---|---|
| Concepcion | 0% |
| Punta Arenas | 0% |
| South Africa | |
|---|---|
| Capetown | 0% |
| Durban | 0% |
| Uruguay | |
|---|---|
| Montevideo | 0% |
Latest news
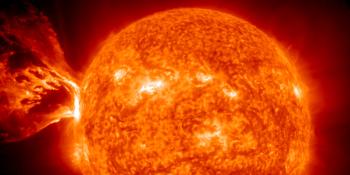
X1.1 solar flare
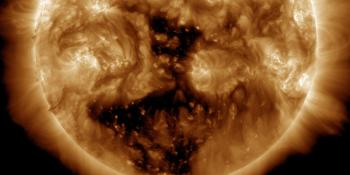
Coronal hole faces Earth
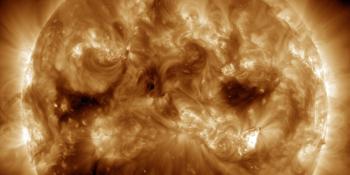
Strong G3 geomagnetic storm watch for 23 March
Latest forum messages
Support SpaceWeatherLive.com!
A lot of people come to SpaceWeatherLive to follow the Sun's activity or if there is aurora to be seen, but with more traffic comes higher server costs. Consider a donation if you enjoy SpaceWeatherLive so we can keep the website online!

Space weather facts
| Last X-flare | 2025/03/28 | X1.1 |
| Last M-flare | 2025/04/14 | M4.2 |
| Last geomagnetic storm | 2025/04/06 | Kp5 (G1) |
| Spotless days | |
|---|---|
| Last spotless day | 2022/06/08 |
| Monthly mean Sunspot Number | |
|---|---|
| March 2025 | 134.2 -20.4 |
| April 2025 | 132.1 -2.1 |
| Last 30 days | 130.6 -13.6 |