M2.0/M2.6 CME analysis, weak CME impact
Sunday, 21 June 2015 18:03 UTC

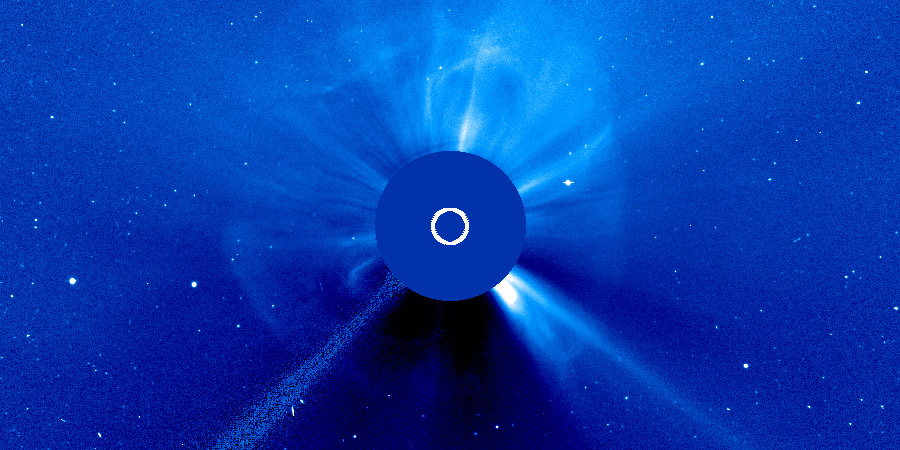
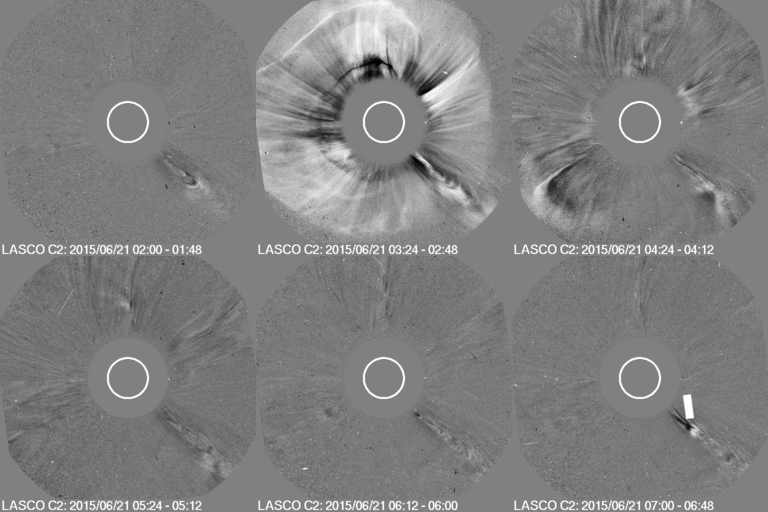
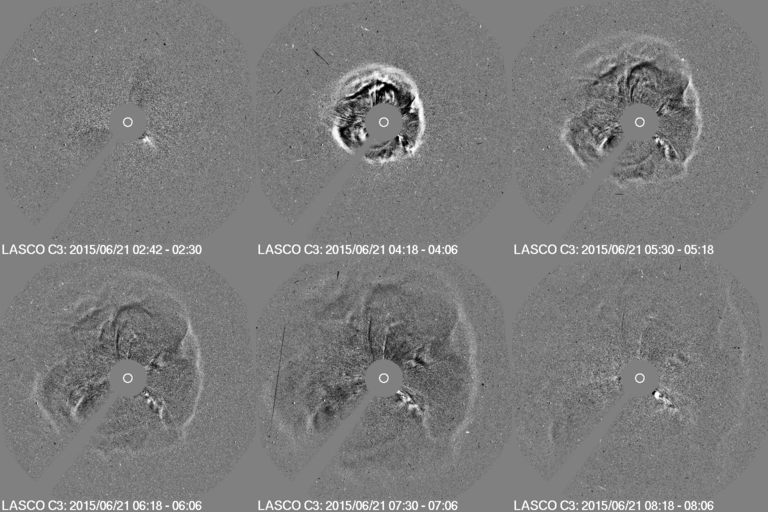
SOHO imagery is complete and that means it is time to analyse the coronal mass ejection from this morning's double peaked M2.0/M2.6 solar flare. For more information regarding these solar flares please read this news article.


Images: ESA/NASA SOHO/LASCO C2 and C3 difference animations showing a clear front-side full halo coronal mass ejection. A textbook example of how an earth-directed coronal mass ejection looks like.
As said before, a clear symmetrical full halo coronal mass ejection became visible following the event and it was right away clear that this coronal mass ejection will not miss Earth. No risk of a glancing blow here, this event won't miss our little planet.
Analysis
The SIDC reports that this coronal mass ejection has a speed of 1000 to 1300km/s which puts the arrival time late tomorrow evening (22:00 UTC on 22 June) with a plus/minus of 6 hours if we take 1150km/s as average. A transit time of less than 48 hours.
NOAA's ENLIL model puts the arrival time at 15:00 UTC tomorrow (June 22) but that means this coronal mass ejection would have a transit time of just 36 hours and that seems very fast. It looks as if the coronal mass ejection on their ENLIL model travels trough a vacuum left behind by a coronal hole stream before encountering the stream itself but we think that this coronal mass ejection is more likely to interact with the stream earlier on and it will not have such a free passage through interplanetary space.
It is however going to be a very interesting impact. While there is no doubt that this coronal mass ejection is directed towards Earth, it can not be predicted how this coronal mass ejection will interact with the coronal hole stream and how this affacts the impact. Are we going to see impressive IMF values as they interact or is it going to have a negative impact? There is a big unknown here and that makes it very hard to make a proper prediction. We do think that given the above average speed of this coronal mass ejection, and the clear symmetrical full halo that with a southward direction IMF (Bz) and a solar wind speed in excess of 600km/s at impact we could very well see a period where we reach the strong G3 geomagnetic storm threshold.
This means that we issue a middle latitude auroral activity watch for the following locations. Sky watchers at or near the locations below should be alert for possible aurora if we reach Kp7 during their darkest hours:
North America:
Salt Lake City (UT, USA) Denver (CO, USA) Nashville (TN, USA) Richmond (VA, USA)
Europe:
London (England) Brussels (Belgium) Cologne (Germany) Dresden (Germany) Warsaw (Poland)
Southern Hemisphere:
Melbourne (Australia) Wellington (New Zealand)
Weak coronal mass ejection passage
The coronal mass ejection from a M3 solar flare on 18 June is now passing the ACE spacecraft. Minor to moderate geomagnetic storming was expected but the impact looks really weak right now with the solar wind speed only jumping to 350km/s and a total IMF strength (Bt) of just 6nT. The solar wind density did climb to a respectable 30 p/cm3.
With the current stats we have to conclude that geomagnetic storming is not to be expected now but keep following the data live on www.spaceweatherlive.com to see how the impact unfolds.
We also just crossed the 10.000 likes threshold on our Facebook page. Thank you everyone for following us! 
Thank you for reading this article! Did you have any trouble with the technical terms used in this article? Our help section is the place to be where you can find in-depth articles, a FAQ and a list with common abbreviations. Still puzzled? Just post on our forum where we will help you the best we can!
Latest news
Latest forum messages
Support SpaceWeatherLive.com!
A lot of people come to SpaceWeatherLive to follow the Sun's activity or if there is aurora to be seen, but with more traffic comes higher server costs. Consider a donation if you enjoy SpaceWeatherLive so we can keep the website online!

Space weather facts
| Last X-flare | 2025/03/28 | X1.1 |
| Last M-flare | 2025/04/01 | M2.5 |
| Last geomagnetic storm | 2025/03/27 | Kp5 (G1) |
| Spotless days | |
|---|---|
| Last spotless day | 2022/06/08 |
| Monthly mean Sunspot Number | |
|---|---|
| February 2025 | 154.6 +17.6 |
| April 2025 | 147 -7.6 |
| Last 30 days | 128.8 -21.8 |


