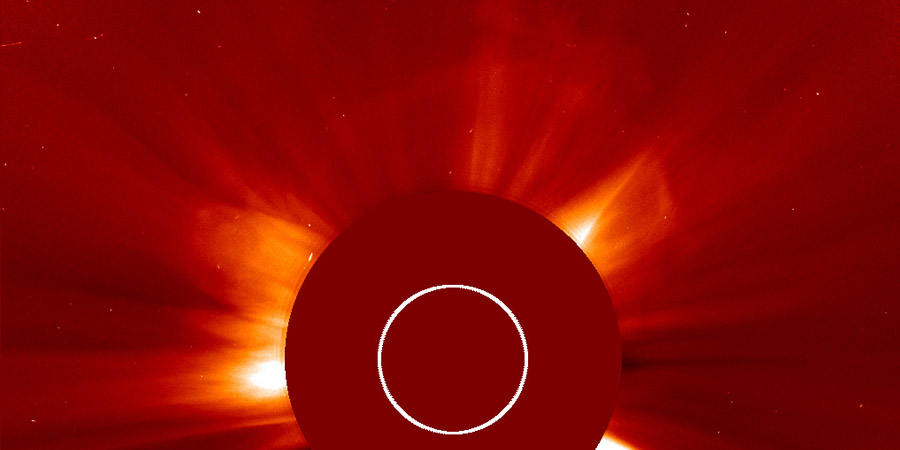
C8.9 CME, M1.0 solar flare
Friday, 12 February 2016 13:17 UTC

Sunspot region 2497 produced a long duration C8.9 solar flare yesterday (peak at 21:03 UTC) that produced a coronal mass ejection which was partially launched towards Earth.
For more details about the solar flare be sure to read our news item from yesterday.
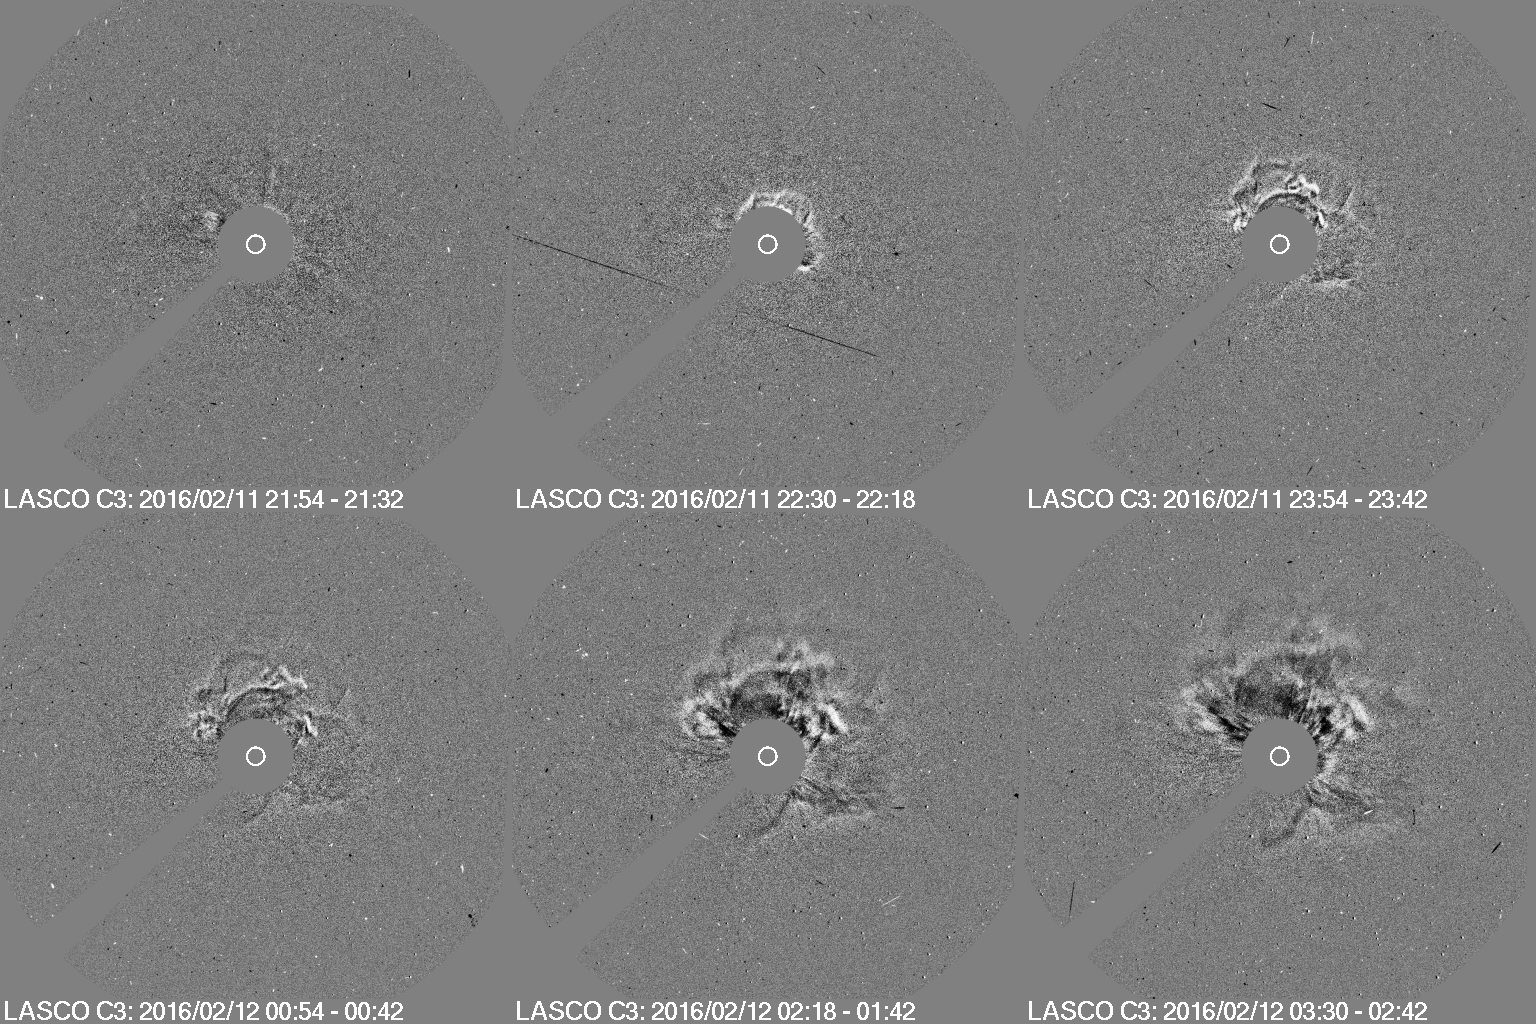
A faint partial halo coronal mass ejection was launched with an angular width of about 270 degrees. Most of the ejected material is heading well north and west of our planet but we are confident that at least a part of this plasma cloud will interact with Earth. A glancing blow will likely arrive at Earth.


Animations: SOHO/LASCO C2 and C3 coronagraph animations showing the partial halo CME.
We do not have a speed measurment from CACtus at the moment so we do not have an accurate way to determine the speed of this plasma cloud but we estimate with our own methods that this coronal mass ejection travels somewhere around 600 km/s. By using this speed and taking into account the current background solar wind speed we estimate that this coronal mass ejection is likely to arrive around 3:00 UTC (plus/minus 6 hours) on 15 February 2016. Minor G1 geomagnetic storm conditions are likely on 15 February when the cloud arrives and moderate G2 geomagnetic storm conditions can not be excluded if the direction of the interplanetary magnetic field (IMF) cooperates.
As always, it is hard to accurately estimate coronal mass ejection arrival times so we recommend to keep an eye on the solar wind data starting Sunday and see what will happen. You can also sign up for our Twitter alerts where our automated coronal mass ejection detection system sends out a tweet once a coronal mass ejection impact has been detected.
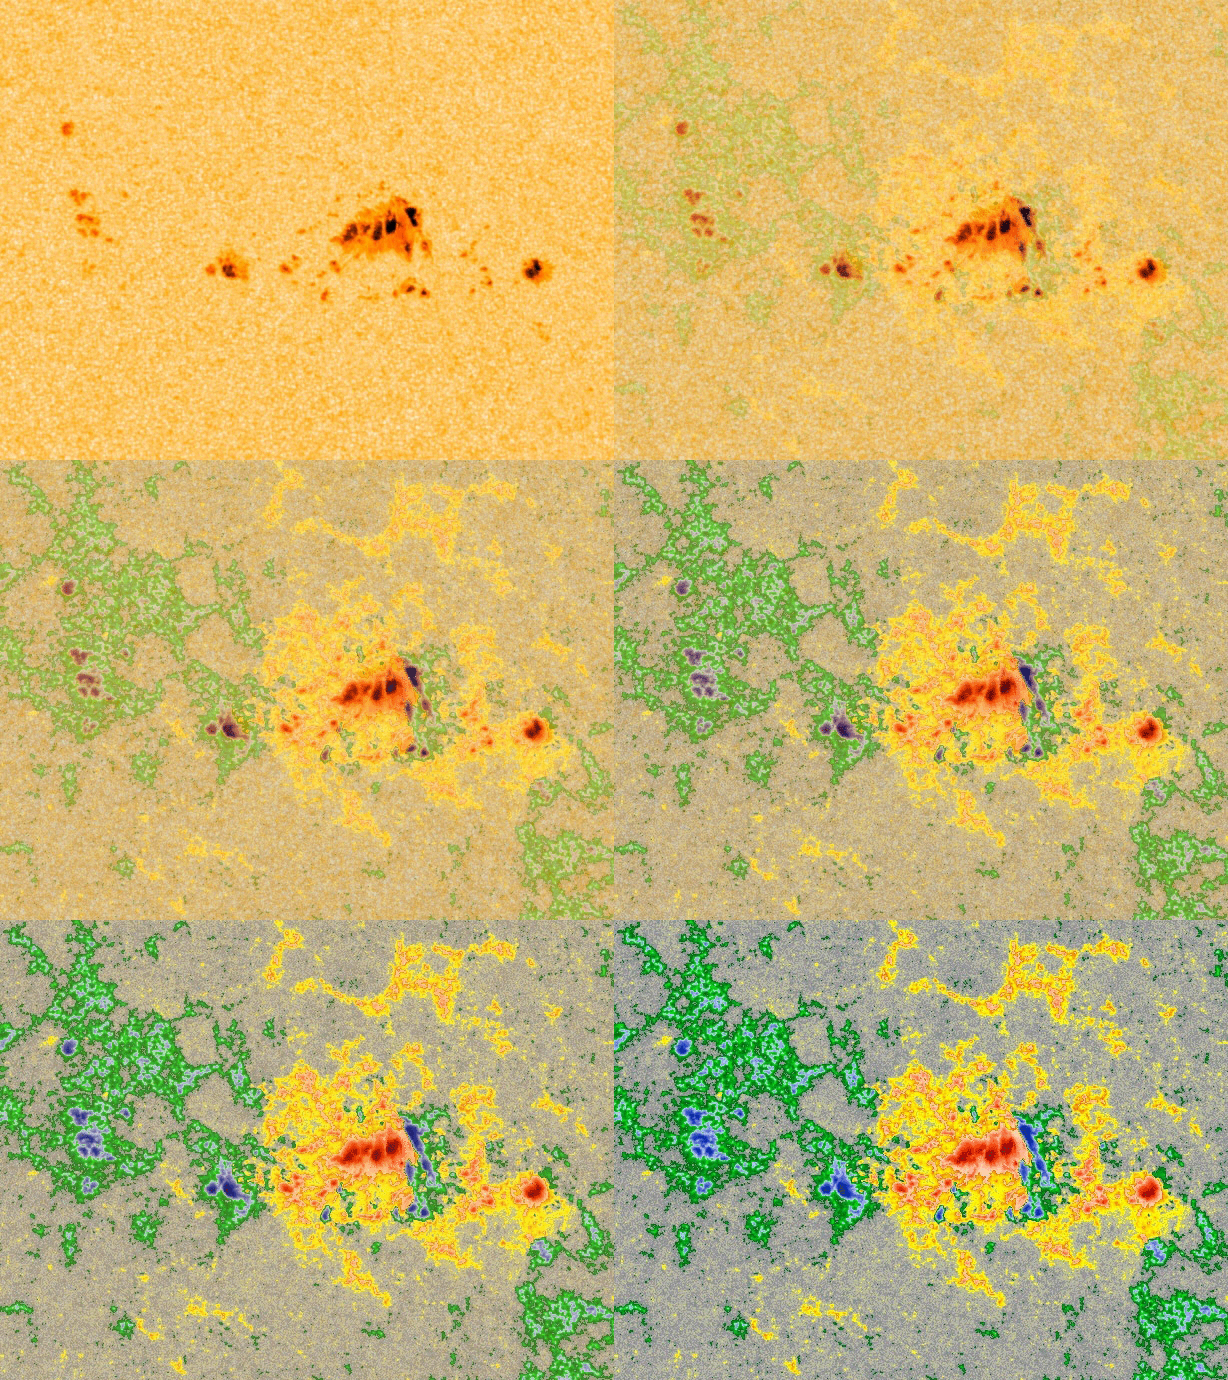
Sunspot region 2497
Sunspot region 2497 has grown since yesterday's C8.9 solar flare and now has a complex Beta-Gamma-Delta structure. Two magnetic delta structures can be found and this resulted in an impulsive M1.0 solar flare (R1) solar flare that peaked at 10:47 UTC. It was an impulsive solar flare and there was likely no coronal mass ejection associated with this event. If future coronagraph imagery reveals the presence of a coronal mass ejection we will of course post additional information later on.

Thank you for reading this article! Did you have any trouble with the technical terms used in this article? Our help section is the place to be where you can find in-depth articles, a FAQ and a list with common abbreviations. Still puzzled? Just post on our forum where we will help you the best we can!
Latest news
Latest forum messages
Support SpaceWeatherLive.com!
A lot of people come to SpaceWeatherLive to follow the Sun's activity or if there is aurora to be seen, but with more traffic comes higher server costs. Consider a donation if you enjoy SpaceWeatherLive so we can keep the website online!

Space weather facts
| Last X-flare | 2025/03/28 | X1.1 |
| Last M-flare | 2025/04/01 | M2.4 |
| Last geomagnetic storm | 2025/03/27 | Kp5 (G1) |
| Spotless days | |
|---|---|
| Last spotless day | 2022/06/08 |
| Monthly mean Sunspot Number | |
|---|---|
| February 2025 | 154.6 +17.6 |
| Last 30 days | 128.1 -22.5 |


