Strong G3 geomagnetic storm
Sunday, 28 May 2017 14:50 UTC

A coronal mass ejection arrived at our planet yesterday and managed to cause an unexpectedly strong geomagnetic storm. The strong G3 geomagnetic storm threshold was reached today at 04:19 UTC.
Strong G3 geomagnetic storm (Kp7)
— SpaceWeatherLive (@_SpaceWeather_) May 28, 2017
Threshold Reached: 04:19 UTC
Follow live on https://t.co/Zkq26B89Y7 pic.twitter.com/gxQeJrk5ng
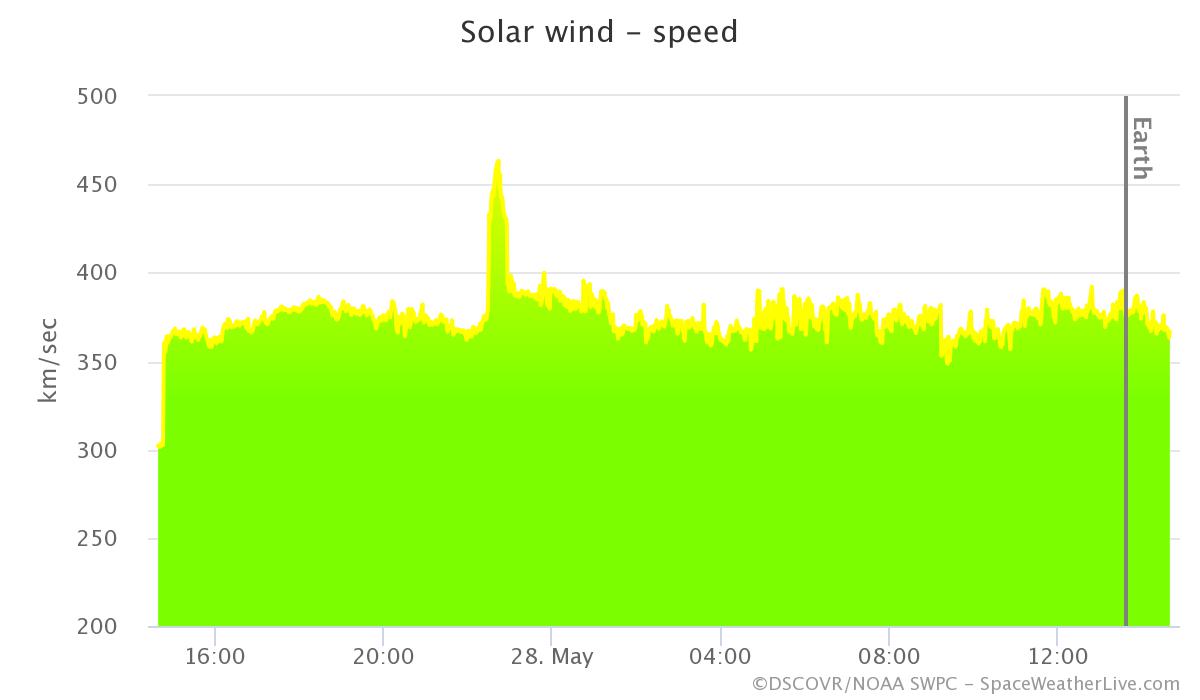
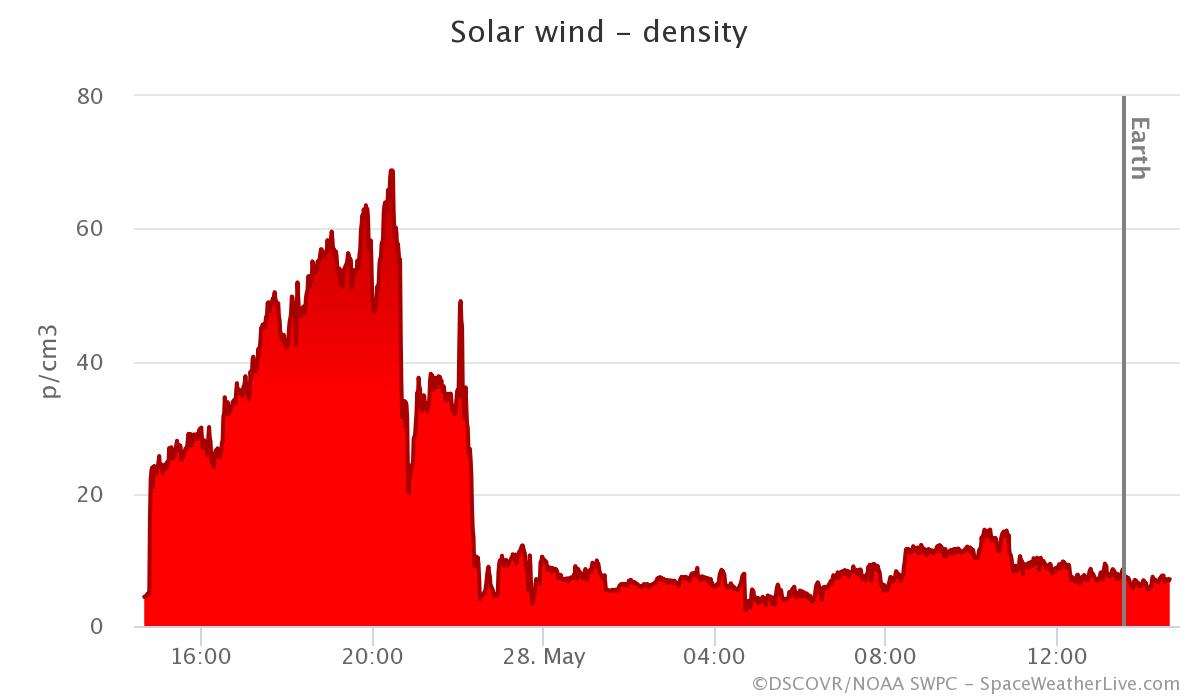
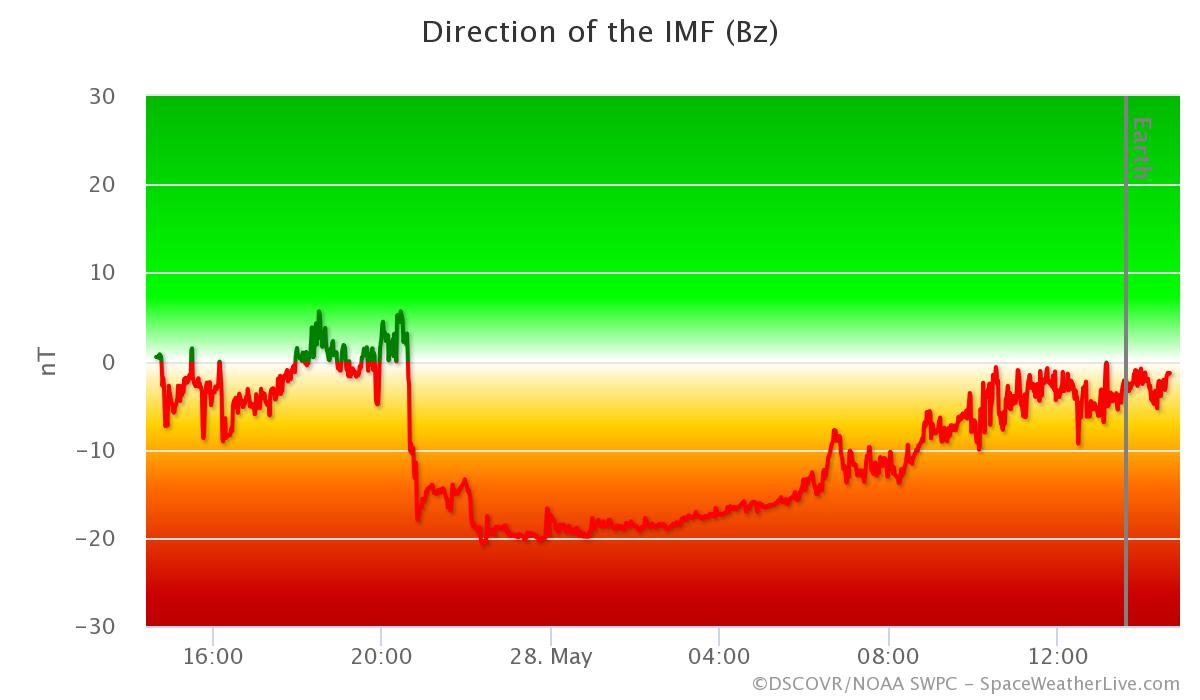
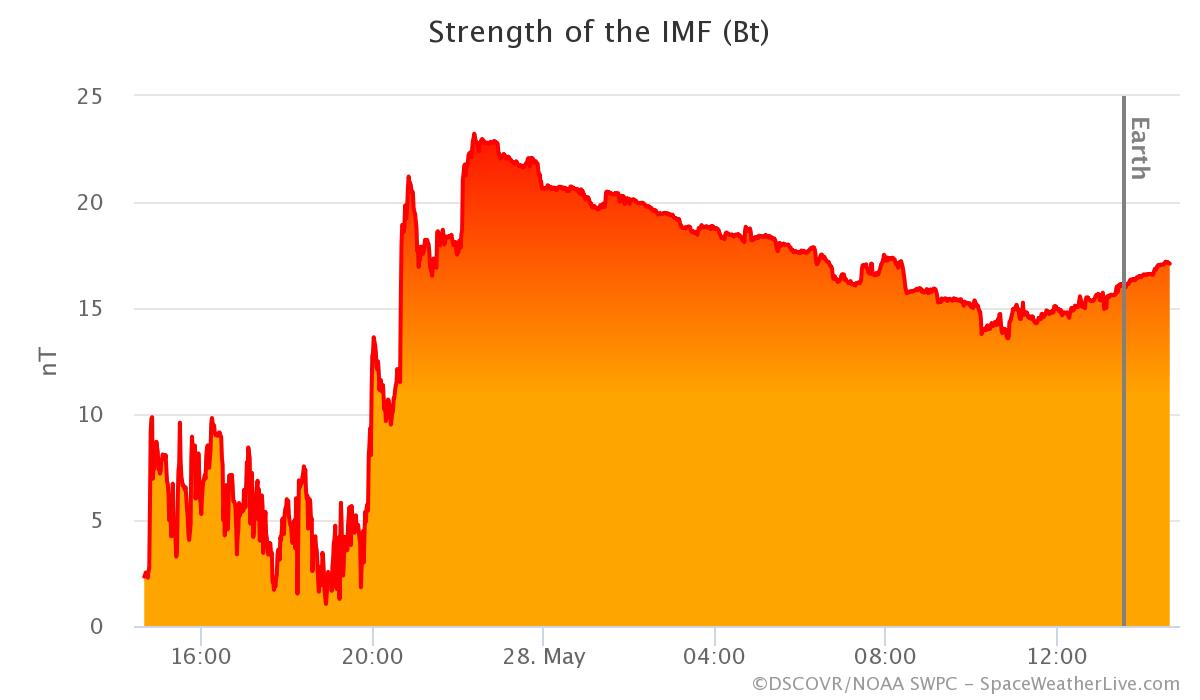
The impact was weak at first and there was no reason to believe we would be getting such a strong geomagnetic storm. However, around 21:00 UTC last night we entered the core of the plasma cloud causing the Bt to shoot up to a maximum of 22nT and the north-south direction of the IMF dropped to values around -20nT for several hours. The geomagnetic field responded immediately with two 3-hour periods with G2 geomagnetic storming and G3 geomagnetic storming during the 03-06 UTC time window.
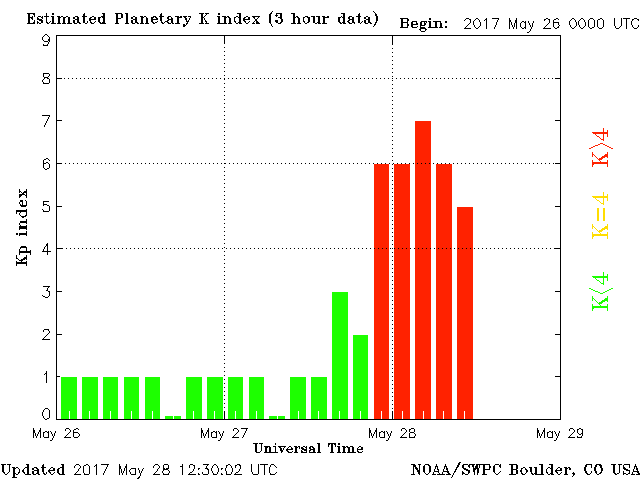
The storm sparked amazing auroral displays around the world. Locations like the Netherlands, England, the northern US, New Zealand and southern Australia witnessed brilliant auroral displays.
We will be posting images and videos of this geomagnetic storm on our Facebook page so be sure to like us there!
Header image: Aurora Australis captured in Tasmania, Australia by Sophie Fazackerle.
Thank you for reading this article! Did you have any trouble with the technical terms used in this article? Our help section is the place to be where you can find in-depth articles, a FAQ and a list with common abbreviations. Still puzzled? Just post on our forum where we will help you the best we can!
Latest news
Latest forum messages
Support SpaceWeatherLive.com!
A lot of people come to SpaceWeatherLive to follow the Sun's activity or if there is aurora to be seen, but with more traffic comes higher server costs. Consider a donation if you enjoy SpaceWeatherLive so we can keep the website online!

Space weather facts
| Last X-flare | 2025/03/28 | X1.1 |
| Last M-flare | 2025/04/20 | M1.0 |
| Last geomagnetic storm | 2025/04/20 | Kp5 (G1) |
| Spotless days | |
|---|---|
| Last spotless day | 2022/06/08 |
| Monthly mean Sunspot Number | |
|---|---|
| March 2025 | 134.2 -20.4 |
| April 2025 | 119.2 -15 |
| Last 30 days | 113.3 -31 |


