M1.3 solar flare, G1 geomagnetic storm
Sunday, 9 July 2017 10:44 UTC

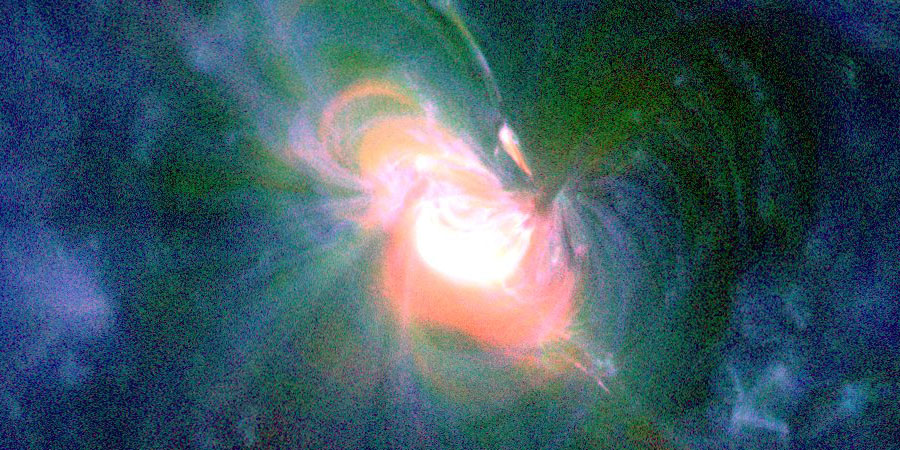
An M1.38 solar flare took place this night that peaked at 03:18 UTC. It came from the only numbered sunspot region on the earth-facing solar disk: sunspot region 2665.
Moderately strong M1.38 solar #flare
— SpaceWeatherLive (@_SpaceWeather_) July 9, 2017
Follow live on https://t.co/3Xxrvc3cpA pic.twitter.com/FciLur4EWG
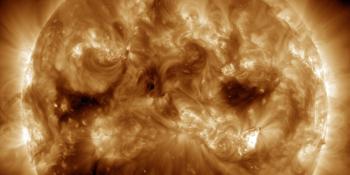
The solar flare was not eruptive (it did not launch a coronal mass ejection) but our Sun has picked up the pace when it comes to flaring activity as sunspot region 2665 also produced numerous C-class events. We must admit... last night we made a post on our Facebook page where we mentioned that M-class activity was unlikely. So... what changed? Why did it produce this M-class solar flare and can we expect more? Let's grab some images from SDO and find out!

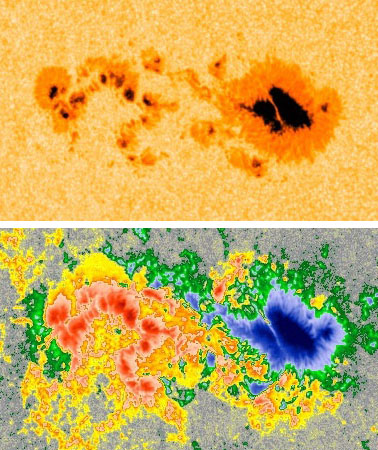
The above images show us sunspot region 2665 in visible light (top) and a magnetogram (bottom) showing the magnetic configuration of this group. Is there something interesting that we can spot right away? Yes! Look at the magnetic mixing. The red and blue colors (magnetic polarities) aren't nicely divided but they are mixed together. This is good news as that is a good sign that a group has the potential for some nice solar flares.
There is even one magnetic delta structure (two if you are an optimist) to be found in the northern most part of this group and the second one just south of the leader spot. If you aren't sure what a magnetic delta structure is be sure to read our help article. The NOAA SWPC gave sunspot region 2665 a Beta classification earlier today but we changed this on our website to a Beta-Gamma-Delta magnetic classification as it clearly developed into a complex sunspot region which deserves the BGD stamp.
Can we expect more M-class activity? Yes, we think more M-class solar flares are possible if it keeps its current magnetic configuration. Sunspot region 2665 really changed and developed during the past 12 hours or so and these changes were very good for flaring activity. It has gotten much more complex and this can be seen in the solar X-ray flux which has been above average all night, accumulating with an M1.3 solar flare. There will also be a chance that an eruptive solar flare could launch a coronal mass ejection towards our planet now as the group rotates into a more favourable earth-facing position in the coming days.
Did I hear someone say X-class solar flares? Well... do not expect an X-class solar flare any time soon. It is not complex enough for that just yet! The delta(s) is/are small and not so compact yet so the magnetic tension to produce such strong events likely isn't there... yet.
Minor G1 geomagnetic storm
A coronal hole solar wind stream arrived at our planet this night and already caused two periods with minor G1 geomagnetic storm conditions. The north-south direction of the IMF (Bz) is variable but does dip as low as -10nT occasionally and that means more geomagnetic storming up to the minor G1 geomagnetic storm level will be possible.
Minor G1 geomagnetic storm (Kp5)
— SpaceWeatherLive (@_SpaceWeather_) July 9, 2017
Threshold Reached: 02:30 UTC
Follow live on https://t.co/Zkq26B89Y7 pic.twitter.com/Gbj5ATlezE
Minor G1 geomagnetic storm (Kp5)
— SpaceWeatherLive (@_SpaceWeather_) July 9, 2017
Threshold Reached: 10:20 UTC
Follow live on https://t.co/Zkq26B89Y7 pic.twitter.com/wqDFqSLw57
Thank you for reading this article! Did you have any trouble with the technical terms used in this article? Our help section is the place to be where you can find in-depth articles, a FAQ and a list with common abbreviations. Still puzzled? Just post on our forum where we will help you the best we can!
Latest news
Latest forum messages
Support SpaceWeatherLive.com!
A lot of people come to SpaceWeatherLive to follow the Sun's activity or if there is aurora to be seen, but with more traffic comes higher server costs. Consider a donation if you enjoy SpaceWeatherLive so we can keep the website online!

Space weather facts
| Last X-flare | 2025/03/28 | X1.1 |
| Last M-flare | 2025/04/01 | M2.5 |
| Last geomagnetic storm | 2025/03/27 | Kp5 (G1) |
| Spotless days | |
|---|---|
| Last spotless day | 2022/06/08 |
| Monthly mean Sunspot Number | |
|---|---|
| February 2025 | 154.6 +17.6 |
| April 2025 | 147 -7.6 |
| Last 30 days | 128.8 -21.8 |


