Sunspot region 2670
Wednesday, 2 August 2017 16:49 UTC

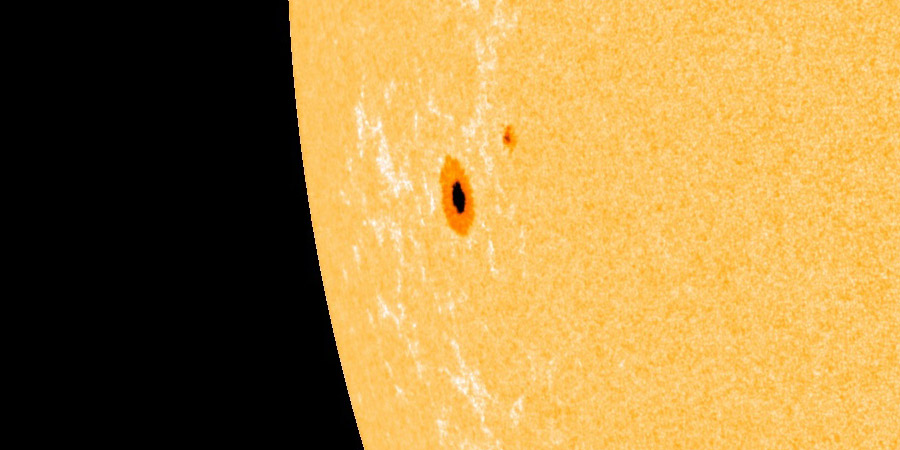
Old sunspot region 2665 which caused a couple of large far side eruptions has now rotated back onto the earth-facing solar disk. It has received sunspot region number 2670 from the NOAA SWPC. Due to the activity this sunspot region displayed while it was on the far side, hopes were high for its return. So what is left of this group and should we expect more solar flares?
Well... no. We are looking at a sunspot region that was likely much larger on the far side and it has decayed a lot the past week or so. We only see two sunspots at the moment and an enormous amount of faculae. Faculae are bright areas that form when sunspot regions decay so it tells us something about this region's history. Sunspot region 2670 has a lot of faculae surrounding the two spots (see our header image made using the white light SDO/HMI image) which is a sign that this group used to be much larger and has decayed significantly.
Also worth nothing is that the region produced no major coronal mass ejections since 28 July so it is pretty safe to say that this region is down for the count. At least for now. It can regrow new spots so we shouldn't rule out the region completely but for now the chance that we are getting a strong solar flare from this region seems very low.
Thank you for reading this article! Did you have any trouble with the technical terms used in this article? Our help section is the place to be where you can find in-depth articles, a FAQ and a list with common abbreviations. Still puzzled? Just post on our forum where we will help you the best we can!
Latest news
Latest forum messages
Support SpaceWeatherLive.com!
A lot of people come to SpaceWeatherLive to follow the Sun's activity or if there is aurora to be seen, but with more traffic comes higher server costs. Consider a donation if you enjoy SpaceWeatherLive so we can keep the website online!

Space weather facts
| Last X-flare | 2025/03/28 | X1.1 |
| Last M-flare | 2025/04/01 | M5.6 |
| Last geomagnetic storm | 2025/03/27 | Kp5 (G1) |
| Spotless days | |
|---|---|
| Last spotless day | 2022/06/08 |
| Monthly mean Sunspot Number | |
|---|---|
| February 2025 | 154.6 +17.6 |
| Last 30 days | 128.5 -22.7 |


