X8.2 coronal mass ejection
Monday, 11 September 2017 16:42 UTC

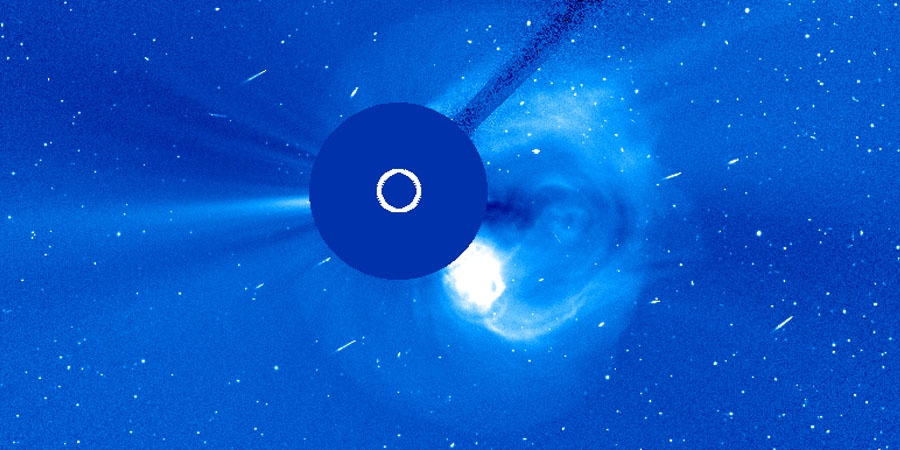
Yesterday's X8.2 (R3-strong) solar flare from sunspot region 2673 was one of the most spectacular solar flares we have ever seen. Not only was this the second strongest solar flare of the current solar cycle, it also launched an extremely fast and broad coronal mass ejection. What a way to say goodbye! Let's hope it survives its 2 week journey on the far side of the Sun!
As a matter of fact, sunspot region 2673 was already behind the western limb when the solar flare erupted. We will never know for sure but this event might have been even stronger than an X8.2 solar flare if sunspot region 2673 was still present on the earth-facing side of the solar disk. You can find more information in yesterday's news article.
Following the flare, we quickly reached the strong S3 solar radiation storm level which only takes place about 10 times during a 11 year solar cycle. Possible effects of the ongoing S3 solar radiation storm are: degraded HF radio propagation at polar regions and navigation position errors, satellite effects on imaging systems and solar panel currents, significant radiation hazard to astronauts on extra-vehicular activity (EVA) and high-latitude aircraft passengers.
The coronal mass ejection is as far as we can remember one of the fastest coronal mass ejections of the current solar cycle as we measured the ejecta at a whopping 2.700km/s to 2.800km/s! To compare: The X28 coronal mass ejection from 4 November 2003 left the Sun at 2.400km/s! Goes to show this is an extreme coronal mass ejection that would without a doubt cause intense geomagnetic storming if it would have been launched directly at Earth.
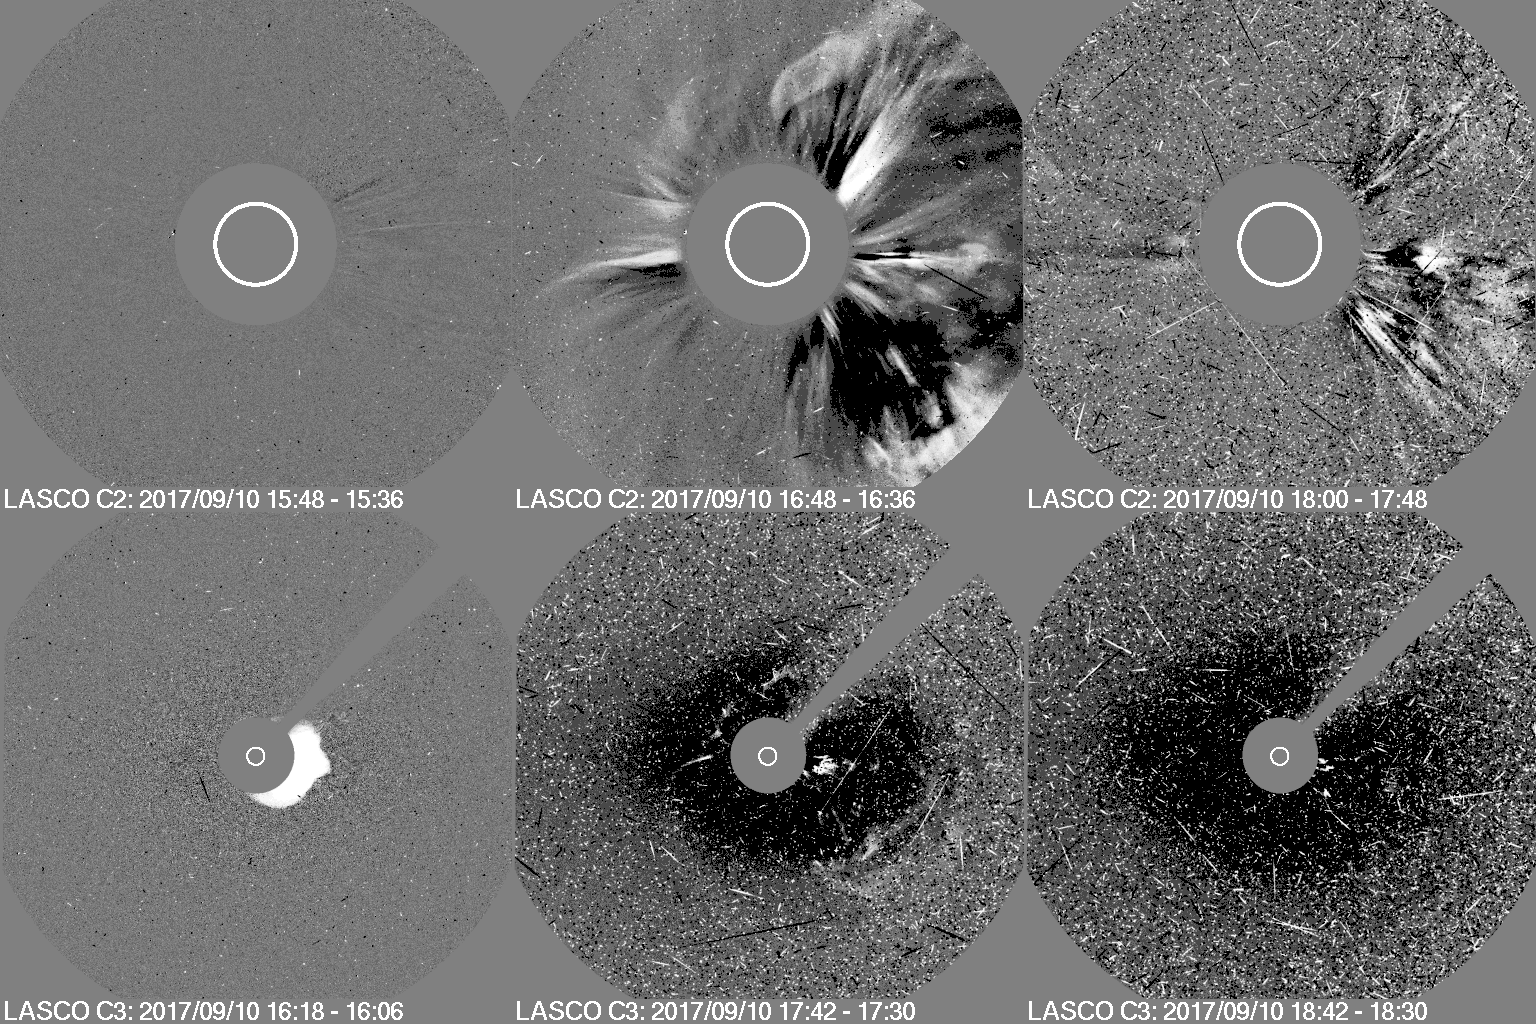
But fair enough, that is not the case. We will have to satisfy us with a glancing blow at best. SOHO/LASCO imagery shows an impressive asymmetrical full halo coronal mass ejection which means the outer edges of the solar plasma cloud are directed straight at (or away) from the observing space craft. It is therefor hard to say if this edge is directed towards the front side, the far side or both but taking into account the monstrous coronal wave and the jump in the low-energy EPAM protons, we are fairly confident that we are going to see at least a shock passage or a glancing blow at Earth. You can see the coronal wave in the tweet that we posted yesterday.

⇧ Animation: SOHO LASCO C2 and C3 difference footage showing the X8.2 coronal mass ejection as it is ejected into space. The noise on the images following the eruption are the result of the solar radiation storm. There is nothing wrong with your computer screen.
The flanks of a coronal mass ejection are always a bit slower than the bulk so we can't go with 2.700km/s but the transit time should still be around one and a half day or about 36 to 40 hours (calculated with SARM) which puts the expected impact time of this coronal mass ejection at 06:00 UTC on 12 September 2017 with a plus/minus of 6 hours. Note that the NOAA SWPC has a much later impact time late on September 13 which was a surprise to us.
It remains to be seen how strong the magnetic field will be at impact as this is a value that can disappoint with these glancing blows but a distinct increase in the solar wind speed up to at least 700km/s should be possible. A minor G1 geomagnetic storm will be possible after the plasma cloud arrives.
Thank you for reading this article! Did you have any trouble with the technical terms used in this article? Our help section is the place to be where you can find in-depth articles, a FAQ and a list with common abbreviations. Still puzzled? Just post on our forum where we will help you the best we can!
Latest news
Latest forum messages
Support SpaceWeatherLive.com!
A lot of people come to SpaceWeatherLive to follow the Sun's activity or if there is aurora to be seen, but with more traffic comes higher server costs. Consider a donation if you enjoy SpaceWeatherLive so we can keep the website online!

Space weather facts
| Last X-flare | 2025/03/28 | X1.1 |
| Last M-flare | 2025/04/01 | M5.6 |
| Last geomagnetic storm | 2025/03/27 | Kp5 (G1) |
| Spotless days | |
|---|---|
| Last spotless day | 2022/06/08 |
| Monthly mean Sunspot Number | |
|---|---|
| February 2025 | 154.6 +17.6 |
| Last 30 days | 128.5 -22.7 |


