Hyped CME, Coronal hole stream inbound
Wednesday, 7 March 2018 16:31 UTC

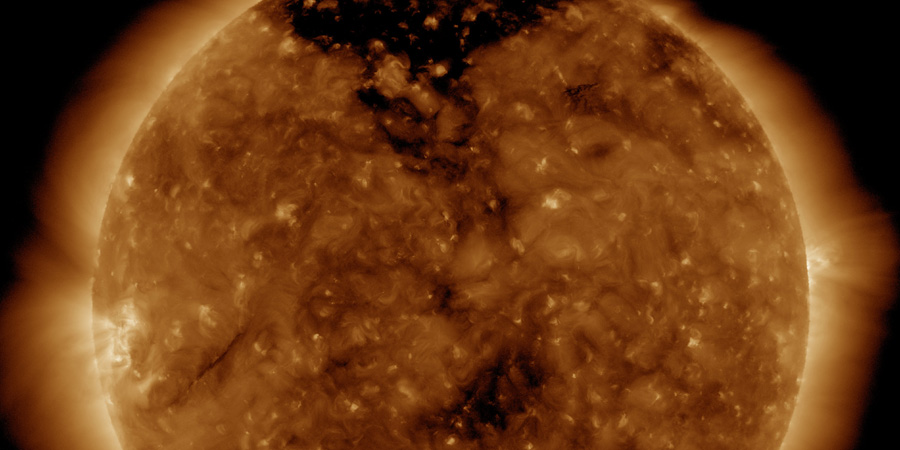
There has been a little bit of a hype on social media about a possible earth-directed coronal mass ejection (CME) coming our way. The plasma cloud isn't a myth and comes from a strange eruption late on 5 March but it was hardly noticeable on SDO.
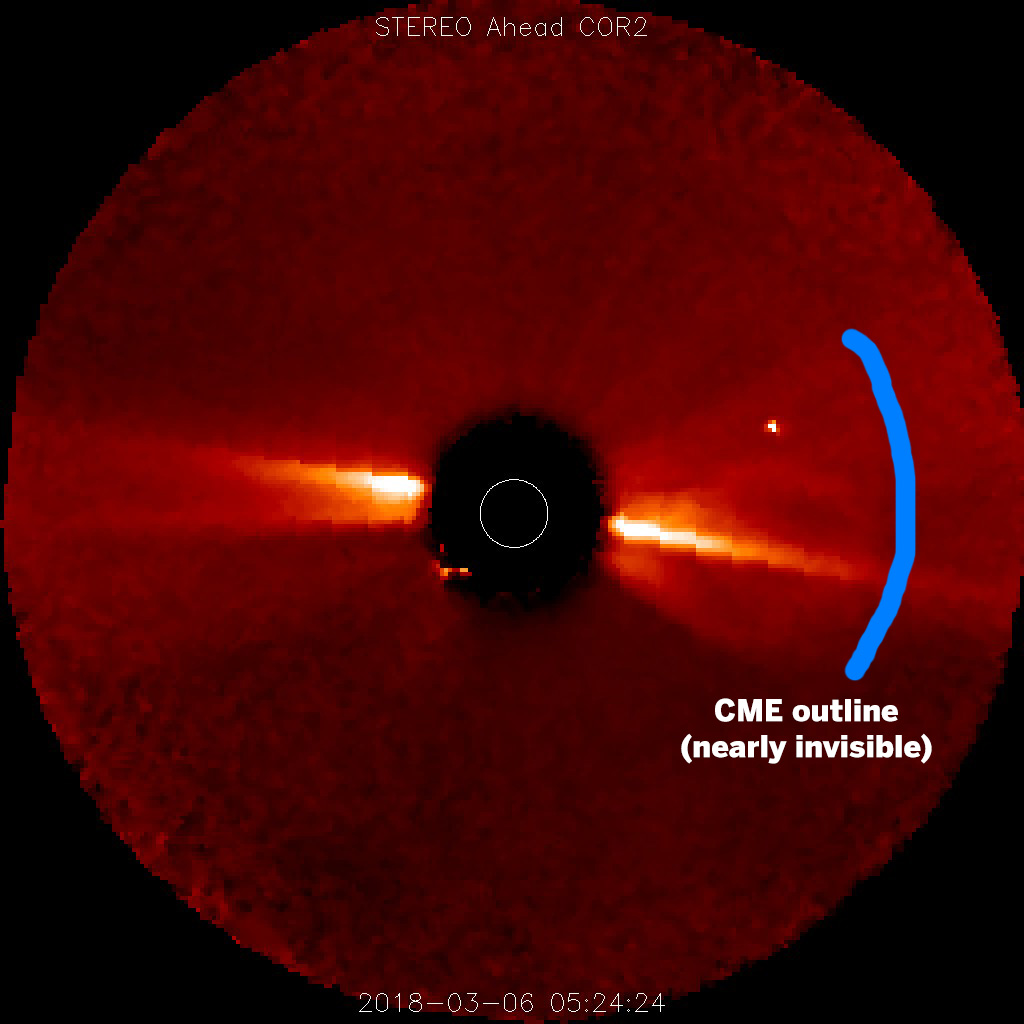
So... while it is true that there was a coronal mass ejection launched in our general direction, the faint appearance and slow speed of this coronal mass ejection will make it highly unlikely that we will notice any sort of impact from this plasma cloud let alone see a geomagnetic response. The plasma cloud was very hard to see on the STEREO Ahead COR2 imagery (see the attached image) and even harder to spot on the SOHO/LASCO images.

Image: the nearly impossible to see CME as seen by STEREO Ahead COR2.
We know a lot of people want more geomagnetic activity and auroral displays but be sensible and do not get hyped over nothing. We hate to be the messenger of bad news but we bring the news how it is! Honest and not sugar coated. This is nothing to get excited about.
For high latitude sky watchers we might have some better news as a minor coronal hole solar wind stream could reach us tomorrow but geomagnetic storming is not expected.
A collapsing filament yesterday did not result in a coronal mass ejection.
Thank you for reading this article! Did you have any trouble with the technical terms used in this article? Our help section is the place to be where you can find in-depth articles, a FAQ and a list with common abbreviations. Still puzzled? Just post on our forum where we will help you the best we can!
Latest news
Latest forum messages
More topicsSupport SpaceWeatherLive.com!
A lot of people come to SpaceWeatherLive to follow the Sun's activity or if there is aurora to be seen, but with more traffic comes higher server costs. Consider a donation if you enjoy SpaceWeatherLive so we can keep the website online!

Space weather facts
| Last X-flare | 2025/03/28 | X1.1 |
| Last M-flare | 2025/04/01 | M2.4 |
| Last geomagnetic storm | 2025/03/27 | Kp5 (G1) |
| Spotless days | |
|---|---|
| Last spotless day | 2022/06/08 |
| Monthly mean Sunspot Number | |
|---|---|
| February 2025 | 154.6 +17.6 |
| April 2025 | 147 -7.6 |
| Last 30 days | 128.8 -21.8 |


