C4.8 solar flare
Wednesday, 20 March 2019 21:09 UTC

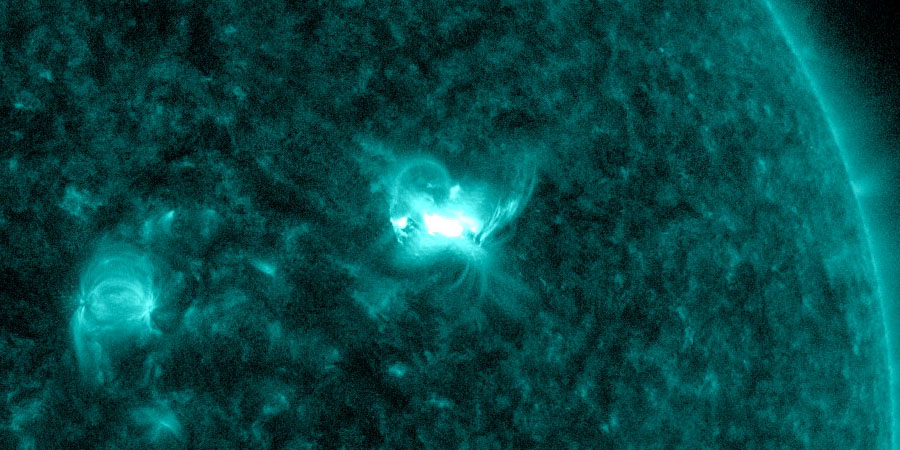
A new sunspot region that received sunspot number 2736 earlier today erupted with a long duration C-class solar flare. The solar flare peaked at 11:18 UTC and reached a maximum X-ray flux of C4.8. The eruption was associated with a Type II radio sweep which indicated straight away that this event was likely to be eruptive and thus launched a coronal mass ejection into space.
We often get questions about what these radio sweeps or radio bursts are so here comes a brief explanation. Coronal mass ejections drive shocks, which accelerate electrons and cause a very specific noise pattern at very specific radio frequencies. Type II and IV shocks are early indicators that an eruption might have taken place on the Sun so that is why we look out for these type of radio sweeps and send out alerts on Twitter and the SpaceWeatherLive Android and iOS app whenever they occur.
But back to main topic of tonight, the C4.8 solar flare. A coronal mass ejection became visible on the coronagraph imagery from STEREO Ahead not too long after the solar flare peaked. Combining these facts it was quickly obvious that a possible earth-directed coronal mass ejection was launched during the C4.8 event.

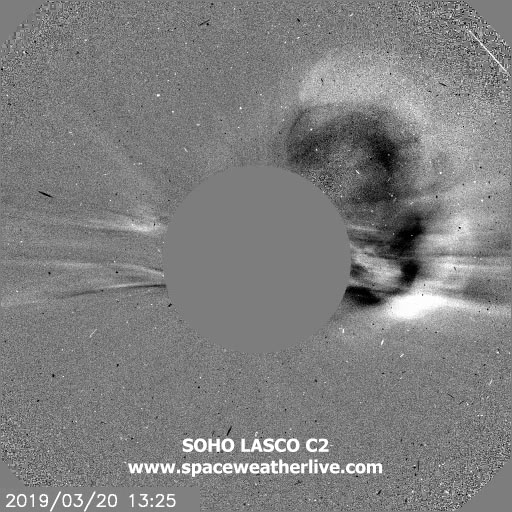
Image: Still image taken from the SOHO LASCO C2 instrument showing the partial halo CME from the C4.8 solar flare.
Looking at the available footage from SOHO LASCO we see indeed the launch of a coronal mass ejection. A partial halo coronal mass ejection is visible with the bulk heading west/north-west with very faint ejecta heading south and north-east of SOHO's point of view. This combined with the favorable location of the eruption at 9 degrees north and 30 degrees west it is likely that we will at least experience a glancing blow at Earth from this plasma cloud. Preliminary speed estimates put the escape velocity of this coronal mass ejection at around 500km/s which suggests a travel time in excess of 3 days.
Our preliminary estimate is that we could see an impact either late on 23 March (after 18 UTC) or early on 24 March (before 06 UTC). Don't get your hopes up too much however. We do not expect to see a strong impact from this event due to the slow speed and the ejecta becomes quickly rather faint on the wider LASCO C3 field of view. Also keep in mind that the plasma cloud is not heading directly towards us but as we said earlier some form of impact at Earth is likely.
At best we should expect geomagnetic storm conditions up to the minor G1 geomagnetic storm level from this event but as always, we can only be sure of what to expect once the plasma cloud passes the DSCOVR space craft.
Thank you for reading this article! Did you have any trouble with the technical terms used in this article? Our help section is the place to be where you can find in-depth articles, a FAQ and a list with common abbreviations. Still puzzled? Just post on our forum where we will help you the best we can!
Latest news
Latest forum messages
More topicsSupport SpaceWeatherLive.com!
A lot of people come to SpaceWeatherLive to follow the Sun's activity or if there is aurora to be seen, but with more traffic comes higher server costs. Consider a donation if you enjoy SpaceWeatherLive so we can keep the website online!

Space weather facts
| Last X-flare | 2025/03/28 | X1.1 |
| Last M-flare | 2025/04/01 | M2.4 |
| Last geomagnetic storm | 2025/03/27 | Kp5 (G1) |
| Spotless days | |
|---|---|
| Last spotless day | 2022/06/08 |
| Monthly mean Sunspot Number | |
|---|---|
| February 2025 | 154.6 +17.6 |
| April 2025 | 147 -7.6 |
| Last 30 days | 128.8 -21.8 |


