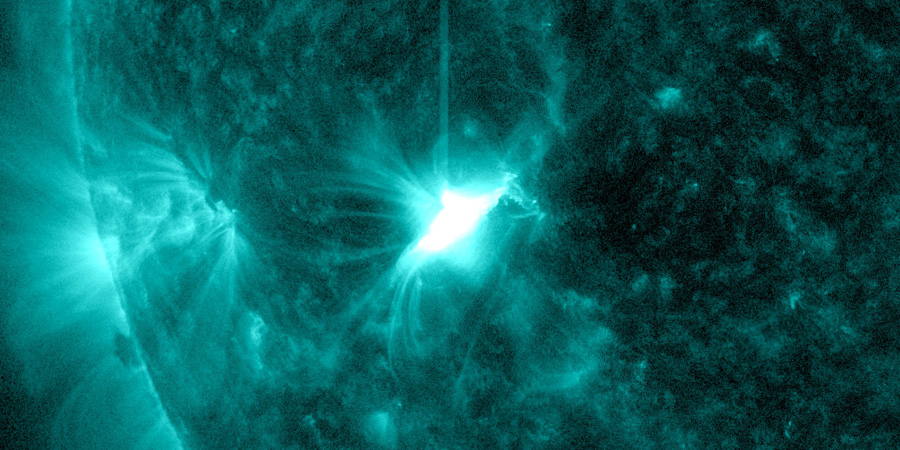
M1.4 solar flare with earth-directed CME
Friday, 25 March 2022 19:08 UTC

A huge surprise at 05:26 UTC today as unimpressive sunspot region 2974 produced a long duration M1.4 solar flare.
It became quickly obvious based on SDO imagery that this event likely was eruptive. Moments later, the confirmation of both Type II and IV radio sweeps added even more confidence to this early conclusion. Now that we have SOHO/LASCO coronagraph imagery we can take a look at the coronal mass ejection and see if it is aimed at Earth. We see an asymmetrical full halo outline but most of the ejecta is heading west. A faint halo outline is visible which does mean a glancing blow is possible on Monday, 28 March. The NOAA SWPC has yet to publish an official forecast but we do not expect geomagnetic storming from this event. The earth-directed portion of the plasma cloud is faint and should only cause limited geomagnetic disturbance at high latitude locations. Nonetheless something to keep an eye on for high latitude sky watchers.
Today's M1.4 solar flare launched a asymmetrical full halo coronal mass ejection into space. The main direction of the CME is towards the west but a faint halo outline is visible. A glancing blow is possible on Monday, 28 March. pic.twitter.com/hnhePPXtcI
— SpaceWeatherLive (@_SpaceWeather_) March 25, 2022
Thank you for reading this article! Did you have any trouble with the technical terms used in this article? Our help section is the place to be where you can find in-depth articles, a FAQ and a list with common abbreviations. Still puzzled? Just post on our forum where we will help you the best we can!
Latest news
Latest forum messages
Support SpaceWeatherLive.com!
A lot of people come to SpaceWeatherLive to follow the Sun's activity or if there is aurora to be seen, but with more traffic comes higher server costs. Consider a donation if you enjoy SpaceWeatherLive so we can keep the website online!

Space weather facts
| Last X-flare | 2025/03/28 | X1.1 |
| Last M-flare | 2025/04/29 | M1.6 |
| Last geomagnetic storm | 2025/04/21 | Kp5+ (G1) |
| Spotless days | |
|---|---|
| Last spotless day | 2022/06/08 |
| Monthly mean Sunspot Number | |
|---|---|
| March 2025 | 134.2 -20.4 |
| April 2025 | 126.5 -7.7 |
| Last 30 days | 126.8 -0.8 |


