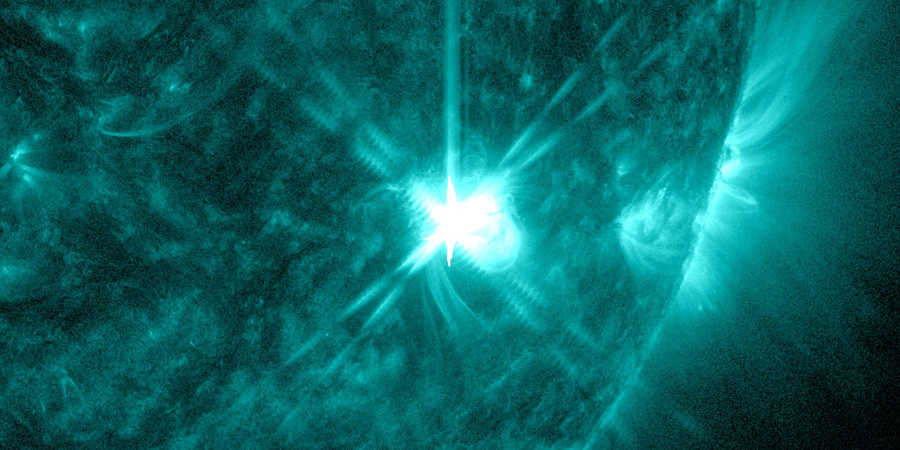
Flares, flares, flares!
Friday, 16 December 2022 19:55 UTC

What a crazy couple of days! After what feels like months of relative silence on our Sun she has really been kicking of the past 72 hours. We had 32 solar flares that reached the M-class threshold over this period. Yes, you did read that right. As of writing this article we counted 32 solar flares that peaked at or above the M1 threshold. Did any of these solar flares produce any significant coronal mass ejections?
First of all it was mostly sunspot region 3165 that got its magnetic field lines in a twist and it was this region produced pretty much all of these solar flares. Two of these solar flares peaked above the M5 (R2-moderate) threshold with an M6.3 solar flare from two days ago being the strongest solar flare of this period. Multiple Type II and IV sweeps were observed in association with all this flare activity but none of the coronal mass ejections that were detected in coronagraph imagery likely have an earth-directed component. Sunspot region 3165 is now near the west limb and any coronal mass ejections is launched will likely not affect Earth. Sunspot region 3163 is facing earth and could produce an M-class event but the chances are not very high at the moment. Nonetheless good to see some solar activity worth mentioning again!
Thank you for reading this article! Did you have any trouble with the technical terms used in this article? Our help section is the place to be where you can find in-depth articles, a FAQ and a list with common abbreviations. Still puzzled? Just post on our forum where we will help you the best we can!
Latest news
Latest forum messages
Support SpaceWeatherLive.com!
A lot of people come to SpaceWeatherLive to follow the Sun's activity or if there is aurora to be seen, but with more traffic comes higher server costs. Consider a donation if you enjoy SpaceWeatherLive so we can keep the website online!

Space weather facts
| Last X-flare | 2025/03/28 | X1.1 |
| Last M-flare | 2025/04/22 | M1.3 |
| Last geomagnetic storm | 2025/04/21 | Kp5+ (G1) |
| Spotless days | |
|---|---|
| Last spotless day | 2022/06/08 |
| Monthly mean Sunspot Number | |
|---|---|
| March 2025 | 134.2 -20.4 |
| April 2025 | 120 -14.2 |
| Last 30 days | 111.9 -31 |


