X1.8 solar flare
Saturday, 20 December 2014 01:20 UTC

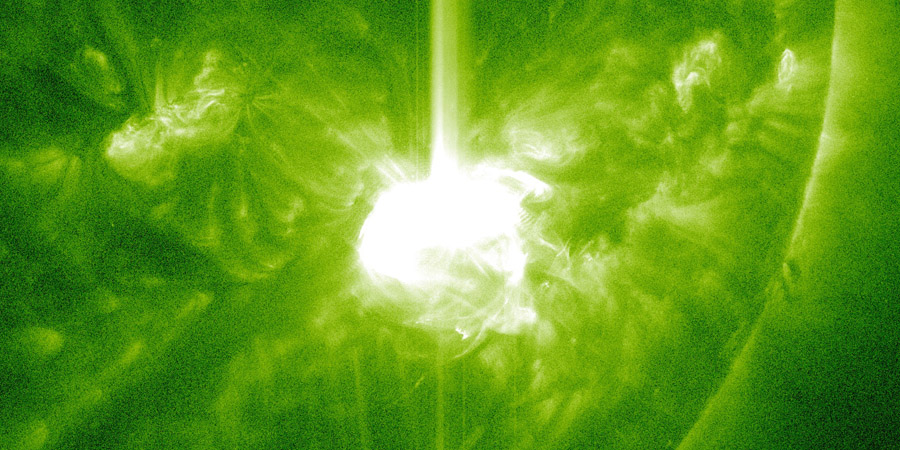
Solar activity reached high levels right at the beginning of 20 December. Sunspot region 2242 produced a long duration X1.88 (R3-strong) solar flare that peaked at 00:28 UTC. It looks like this solar flare is eruptive and launched a coronal mass ejection but will it also come towards earth?
Major X1.88 solar #flare from #sunspot region 12242 - Follow live on http://t.co/8JIfkaXUPc pic.twitter.com/GFte5vtIeI
— SpaceWeatherLive (@_SpaceWeather_) 20 december 2014
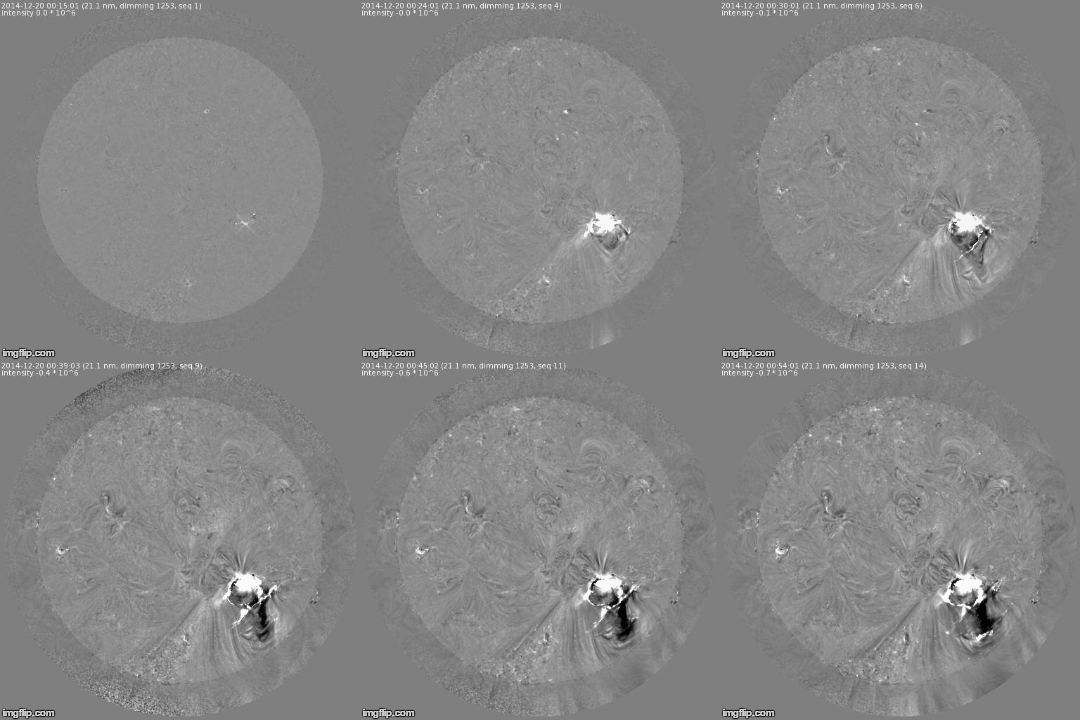
Sunspot region 2242 produced a long duration X1.88 (R3-strong) solar flare that peaked at 00:28 UTC. SDO/AIA imagery shows that material left the solar corona. Coronal dimming (darkening of the corona following the ejection) could be seen and a coronal mass ejection was likely launched. The coronal mass ejection could very well have an earth-directed component as sunspot region 2242 is in a good position to do so but AIA imagery does suggest that most of the material is traveling in a south-western direction. We however need to wait for SOHO imagery to confirm how much material was ejected and if some of it will hit Earth. This should become clear later today.

Another thing to note is that solar radiation storm could occur in the hours ahead as this solar flare occured in the western hemisphere. For more information regarding what a solar radiation storm is please read this page.
We will come back with more information later today once SOHO imagery is available.
ALERT: X-Ray Flux exceeded M5
Threshold Reached: 2014 Dec 20 0020 UTC
NOAA Scale: R2 - Moderate
SUMMARY: X-ray Event exceeded X1
Begin Time: 2014 Dec 20 0011 UTC
Maximum Time: 2014 Dec 20 0028 UTC
End Time: 2014 Dec 20 0055 UTC
X-ray Class: X1.8
Optical Class: 2b
Location: S19W29
NOAA Scale: R3 - Strong

Comment: NOAA Active Region 12242; optical class is preliminary
ALERT: Type II Radio Emission
Begin Time: 2014 Dec 20 0050 UTC
Estimated Velocity: 900 km/s
SUMMARY: 10cm Radio Burst
Begin Time: 2014 Dec 20 0018 UTC
Maximum Time: 2014 Dec 20 0024 UTC
End Time: 2014 Dec 20 0100 UTC
Duration: 52 minutes
Peak Flux: 2300 sfu
Latest Penticton Noon Flux: 216 sfu
Note that there is also a G1 minor geomagnetic storm watch currently in place. You can read more about that if you follow this link.
Images, video and data from: NASA SDO, SIDC and NOAA SWPC.
Thank you for reading this article! Did you have any trouble with the technical terms used in this article? Our help section is the place to be where you can find in-depth articles, a FAQ and a list with common abbreviations. Still puzzled? Just post on our forum where we will help you the best we can!
Latest news
Latest forum messages
Support SpaceWeatherLive.com!
A lot of people come to SpaceWeatherLive to follow the Sun's activity or if there is aurora to be seen, but with more traffic comes higher server costs. Consider a donation if you enjoy SpaceWeatherLive so we can keep the website online!

Space weather facts
| Last X-flare | 2025/03/28 | X1.1 |
| Last M-flare | 2025/03/31 | M1.2 |
| Last geomagnetic storm | 2025/03/27 | Kp5 (G1) |
| Spotless days | |
|---|---|
| Last spotless day | 2022/06/08 |
| Monthly mean Sunspot Number | |
|---|---|
| February 2025 | 154.6 +17.6 |
| March 2025 | 127 -27.6 |
| Last 30 days | 127 -25.7 |


