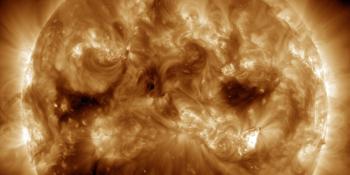
More flares, sunspot regions 2268 & 2277, coronal hole
Friday, 30 January 2015 16:38 UTC
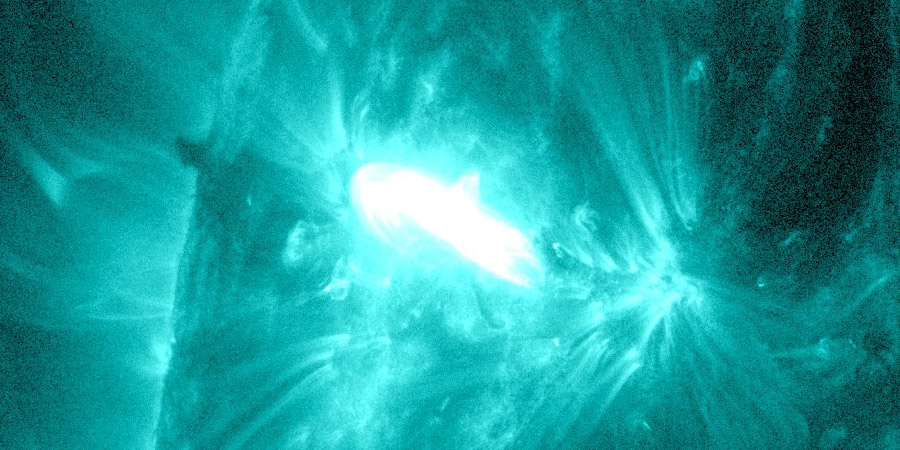
Solar activity remains at moderate levels thanks to four M-class (all R1) solar flares today. Sunspot region 2268 kicked of with an M2.0 solar flare peaking at 00:44 UTC. This event was followed by two more M-class solar flares also from sunspot region 2268 which peaked in rapid succession around 05:45 UTC: M1.6 and M1.7. This event was followed by the strongest solar flare of today thus far: sunspot region 2277 joined the party with an M2.4 solar flare. A lot of solar flares indeed but the bad news is that none of these events looked to have produced a coronal mass ejection. Could we expect more activity from these sunspot regions and what will the southern hemisphere polar coronal hole bring us?
Moderately strong M2.08 solar #flare from #sunspot region 12268 - Follow live on http://t.co/8JIfkaXUPc pic.twitter.com/rf6njgvieV
— SpaceWeatherLive (@_SpaceWeather_) 30 januari 2015
Moderately strong M1.73 solar #flare from #sunspot region 12268 - Follow live on http://t.co/8JIfkaXUPc pic.twitter.com/SSeXuooDkU
— SpaceWeatherLive (@_SpaceWeather_) 30 januari 2015
Moderately strong M1.63 solar #flare from #sunspot region 12268 - Follow live on http://t.co/8JIfkaXUPc pic.twitter.com/IDTlhFB9e6
— SpaceWeatherLive (@_SpaceWeather_) 30 januari 2015
Moderately strong M2.42 solar #flare - Follow live on http://t.co/8JIfkaXUPc pic.twitter.com/TV9BvMi1Sw
— SpaceWeatherLive (@_SpaceWeather_) 30 januari 2015
Sunspot regions 2268 and 2277
Sunspot regions 2268 and 2277 are the largest sunspot regions on the visible solar disk and together with 2271 the most complex sunspot regions visible right now. Sunspot region 2268 is a slow developing sunspot region that did not change much over the last few days but it did produce more solar flares the past few days, this due to some increased complexity in the trailing part of the sunspot region. When looking at this sunspot region right now we can conclude that this sunspot region is still complex with one developing delta spot in the central part of the region. More low-level M-class (R1) solar flares are possible but we do not expect solar flares of the M5-class (R2+) or stronger.
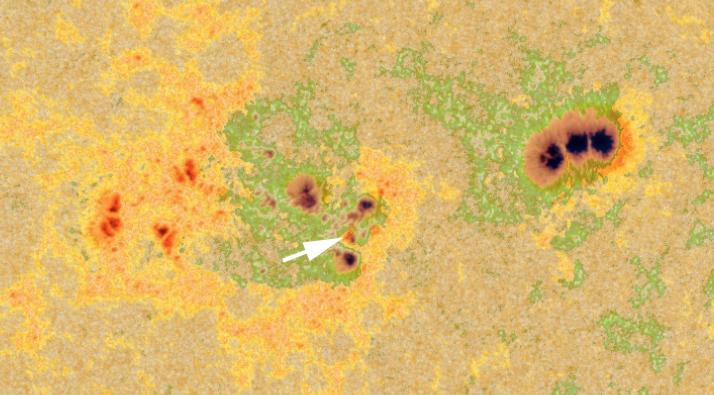
Sunspot region 2277 that rotated onto the solar disk only a few days ago is showing increased activity. It is now fully in sight and we can now determine it’s real magnetic complexity. Since it rotated onto the disk it showed development in the trailing part of the sunspot region and thus also the flare activity from this sunspot region rose once more to moderate levels. The region has a beta-gamma magnetic configuration with a tiny spot with opposite polarity trying to form near a small cluster of spots. More low-level M-class solar flares (R1) are possible but this sunspot region is also unlikely to produce M5 or greater (R2+) solar flares.
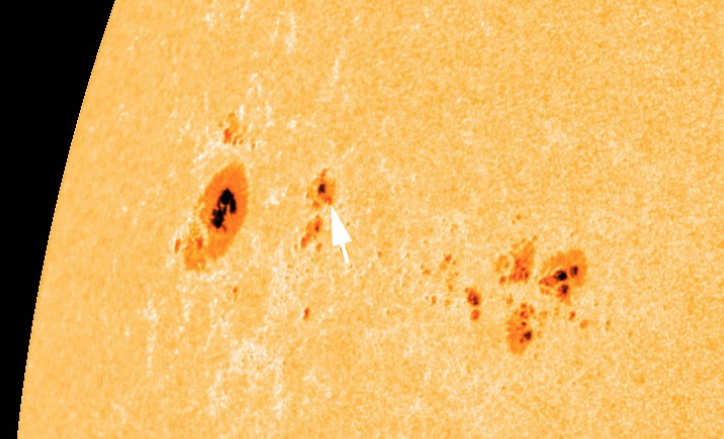
Southern hemisphere coronal hole
Auroral activity was slightly elevated the past 24 hours as we are under the influence of a weak coronal hole high speed stream.
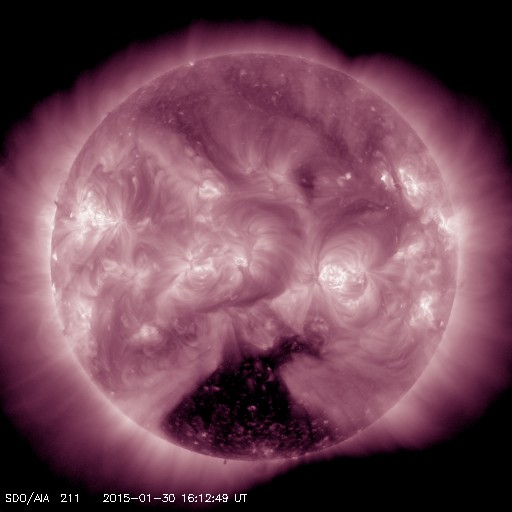
More auroral activity is very much possible in the days ahead as a large and powerful northern extension of the southern hemisphere polar coronal hole is now facing Earth. An enhanced solar wind stream is expect to arrive in about two to three days from now and could very well stir up a minor G1 geomagnetic storm considering how strong this solar wind stream was during the previous rotations.
Thank you for reading this article! Did you have any trouble with the technical terms used in this article? Our help section is the place to be where you can find in-depth articles, a FAQ and a list with common abbreviations. Still puzzled? Just post on our forum where we will help you the best we can!
Latest news
Latest forum messages
Support SpaceWeatherLive.com!
A lot of people come to SpaceWeatherLive to follow the Sun's activity or if there is aurora to be seen, but with more traffic comes higher server costs. Consider a donation if you enjoy SpaceWeatherLive so we can keep the website online!

Space weather facts
| Last X-flare | 2025/03/28 | X1.1 |
| Last M-flare | 2025/04/01 | M2.5 |
| Last geomagnetic storm | 2025/03/27 | Kp5 (G1) |
| Spotless days | |
|---|---|
| Last spotless day | 2022/06/08 |
| Monthly mean Sunspot Number | |
|---|---|
| February 2025 | 154.6 +17.6 |
| April 2025 | 147 -7.6 |
| Last 30 days | 128.8 -21.8 |


