Viewing archive of Tuesday, 15 October 2002
Solar activity report
Any mentioned solar flare in this report has a scaling factor applied by the Space Weather Prediction Center (SWPC). Because of the SWPC scaling factor, solar flares are reported as 42% smaller than for the science quality data. The scaling factor has been removed from our archived solar flare data to reflect the true physical units.
Report of Solar-Geophysical Activity 2002 Oct 15 2200 UTCPrepared by the NOAA © SWPC and processed by SpaceWeatherLive.com
Joint USAF/NOAA Report of Solar and Geophysical Activity
SDF Number 288 Issued at 2200Z on 15 Oct 2002IA. Analysis of Solar Active Regions and Activity from 14-2100Z to 15-2100Z
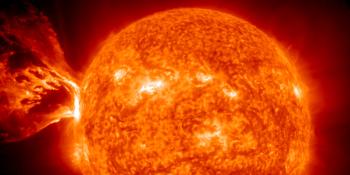
Solar activity was at moderate levels. Region 149
(N14W07) produced the largest event of the period, an M1/1f flare
occurring at 15/1422 UTC. A filament from central meridian through
the southern hemisphere erupted shortly before this flare and is
believed to have been the trigger for the event. SOHO/LASCO imagery
depicts an associated CME to the event which does not appear to be
earth directed. No significant changes were noted today in the spot
group or the magnetic complexity to this region. Region 140
(S08W52) produced a C1/Sf flare at 15/1326 UTC. Newly numbered
Region 161 (N06E00) was assigned today.
IB. Solar Activity Forecast
Solar activity is expected to be at
low to moderate levels. Region 149 has the potential of producing
low level M-class flares.
IIA. Geophysical Activity Summary 14-2100Z to 15-2100Z
The geomagnetic field was at quiet to active levels. A slow, yet
steady, increase in the solar wind speed along with intermittent
periods of southward Bz allowed for the active periods seen today.
IIB. Geophysical Activity Forecast
The geomagnetic field is
expected to remain at quiet to active levels. Weak CME passage
effects may occur in response to the solar activity that occurred on
the 14th and may begin on day one and continue into day two of the
forecast period.
III. Event Probabilities 16 Oct to 18 Oct
| Class M | 40% | 40% | 40% |
| Class X | 05% | 05% | 05% |
| Proton | 01% | 01% | 01% |
| PCAF | green | ||
IV. Penticton 10.7 cm Flux
  Observed       15 Oct 177
  Predicted   16 Oct-18 Oct  175/170/165
  90 Day Mean        15 Oct 182
V. Geomagnetic A Indices
  Observed Afr/Ap 14 Oct  013/026
  Estimated     Afr/Ap 15 Oct  011/015
  Predicted    Afr/Ap 16 Oct-18 Oct  015/015-012/012-012/012
VI. Geomagnetic Activity Probabilities 16 Oct to 18 Oct
| A. Middle Latitudes | |||
|---|---|---|---|
| Active | 30% | 25% | 25% |
| Minor storm | 15% | 10% | 10% |
| Major-severe storm | 05% | 01% | 01% |
| B. High Latitudes | |||
|---|---|---|---|
| Active | 35% | 30% | 25% |
| Minor storm | 15% | 10% | 10% |
| Major-severe storm | 05% | 01% | 01% |
All times in UTC
Latest news
Friday, 28 March 2025
X1.1 solar flare
Monday, 24 March 2025
Coronal hole faces Earth
Saturday, 22 March 2025
Strong G3 geomagnetic storm watch for 23 March
Latest forum messages
AR4048 57Similar AR 3664 vs AR 4048 ??? 6Temporary Topic - Ongoing Solar Proton Events 5Unspecified geomagnetic activity 2176NOAA space weather enthusiasts darhboard 4
More topicsSupport SpaceWeatherLive.com!
A lot of people come to SpaceWeatherLive to follow the Sun's activity or if there is aurora to be seen, but with more traffic comes higher server costs. Consider a donation if you enjoy SpaceWeatherLive so we can keep the website online!

Space weather facts
| Last X-flare | 2025/03/28 | X1.1 |
| Last M-flare | 2025/03/31 | M1.2 |
| Last geomagnetic storm | 2025/03/27 | Kp5 (G1) |
| Spotless days | |
|---|---|
| Last spotless day | 2022/06/08 |
| Monthly mean Sunspot Number | |
|---|---|
| February 2025 | 154.6 +17.6 |
| Last 30 days | 128.5 -22.7 |