Viewing archive of Friday, 10 February 2023
Daily bulletin on solar and geomagnetic activity from the SIDC
Issued: 2023 Feb 10 1231 UTC
SIDC Forecast
Solar flares
M-class flares expected (probability >=50%)
Geomagnetism
Quiet (A<20 and K<4)
Solar protons
Warning condition (activity levels expected to increase, but no numeric forecast given)
| 10cm flux | Ap | |
|---|---|---|
| 10 Feb 2023 | 223 | 014 |
| 11 Feb 2023 | 230 | 012 |
| 12 Feb 2023 | 230 | 004 |
Bulletin
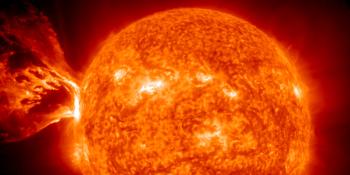
During the past 24 hours, the solar flaring activity has stayed at moderate levels. A total of 22 flares have been reported, of which 5 were M-class flares and 17 were C-class flares. All of the M-class flaring activity originated from NOAA AR 3213 and NOAA AR 3217. NOAA AR 3213 currently has a beta-delta configuration of the photospheric magnetic field. NOAA AR 3217 is presently situated close to the East solar limb. The strongest flare reported was a M3.7 flare originating from NOAA AR 3213 with peak time 03:03UT on February 10. The flare was associated with a type II radio burst indicating presence of the coronal shock wave. The EUV observations above the limb show signatures of a possible associated CME. More will be reported when coronagraph data becomes available. We expect solar flaring activity to stay at moderate levels, with M-class flares expected and a small possibility of X-class flares. The high flaring activity originating from NOAA AR 3213, which is currently well-connected to the Earth, could be associated with a particle event.
During the last 24 hours there were no potentially Earth-directed coronal mass ejections detected in the available coronagraph observations.
The greater than 10 MeV proton flux was at nominal levels over the past 24 hours. Due to the moderate flaring activity it is possible that the greater than 10 MeV proton flux may exceed this threshold over the next 24 hours if there are further high energy flares and eruptions. The greater than 2 MeV electron flux was around the 1000 pfu threshold between 14:20 UT and 18:35UT on February 9 and from 00:00UT to 00:50UT on February 10, barely crossing the threshold. It is expected to remain below the 1000 pfu threshold over the next 24 hours. The 24h electron fluence was at nominal levels and is expected to remain so over the next 24 hours.
The solar wind parameters of the last 24 hours still reflect conditions of the high speed stream that arrived on the 6th of February. The solar wind speed is still slowly decreasing and dropped from about 520 km/s to 480 km/s. The magnitude of the interplanetary magnetic field fluctuated from 4 to 8 nT, with a mainly southward component. We expect to see a continuation of the decline in the solar wind speed as we return towards slow solar wind conditions in the next 24 hours.
During the last 24 hours, the geomagnetic conditions were unsettled (K-Bel=2-5 NOAA-Kp=2-5). Geomagnetic conditions are expected to be quiet to unsettled in the next days.
Today's estimated international sunspot number (ISN): 175, based on 14 stations.Solar indices for 09 Feb 2023
| Wolf number Catania | /// |
| 10cm solar flux | 215 |
| AK Chambon La Forêt | 035 |
| AK Wingst | 021 |
| Estimated Ap | 022 |
| Estimated international sunspot number | 152 - Based on 17 stations |
Noticeable events summary
| Day | Begin | Max | End | Loc | Strength | OP | 10cm | Catania/NOAA | Radio burst types |
|---|---|---|---|---|---|---|---|---|---|
| 09 | 1444 | 1456 | 1505 | N30W18 | M1.5 | 1N | --/3213 | III/2 | |
| 09 | 1514 | 1525 | 1534 | S09E69 | M1.4 | SN | --/3217 | ||
| 09 | 1818 | 1842 | 1902 | ---- | M1.8 | --/3213 | |||
| 10 | 0245 | 0303 | 0320 | N29W25 | M3.7 | 2N | 110 | --/3213 | III/3II/2IV/1 |
| 10 | 0802 | 0805 | 0809 | N31W27 | M1.4 | SN | --/3213 |
Provided by the Solar Influences Data analysis Center© - SIDC - Processed by SpaceWeatherLive
All times in UTC
Latest news
X1.1 solar flare
Coronal hole faces Earth
Strong G3 geomagnetic storm watch for 23 March
Latest forum messages
Support SpaceWeatherLive.com!
A lot of people come to SpaceWeatherLive to follow the Sun's activity or if there is aurora to be seen, but with more traffic comes higher server costs. Consider a donation if you enjoy SpaceWeatherLive so we can keep the website online!

Space weather facts
| Last X-flare | 2025/03/28 | X1.1 |
| Last M-flare | 2025/04/01 | M5.6 |
| Last geomagnetic storm | 2025/03/27 | Kp5 (G1) |
| Spotless days | |
|---|---|
| Last spotless day | 2022/06/08 |
| Monthly mean Sunspot Number | |
|---|---|
| February 2025 | 154.6 +17.6 |
| Last 30 days | 128.5 -22.7 |